The price channel concept is an effective way to detect the trend-changing points to participate in swing trades. Financial traders use this concept to generate trade ideas on many trading assets. So it makes sense that this concept becomes attractive to crypto investors for its easily applicable features.
However, it requires a particular level of understanding of the calculation and components of any specific indicator when using it to create sustainable trading methods. Moreover, following particular guidelines enables participating in the most profitable trades.
This article will introduce the price channel concept alongside listing the top five tips to generate consistently profitable trading positions.
What is the crypto price channel strategy?
The price channel indicator is a technical tool that detects breakouts and breakdown levels of the price movements to generate trade ideas. This indicator has three dynamic bands or levels and suggests opening positions when the price reaches above or below the central band. Three bands of this indicator usually create two channels.
The price enters on any specific channel based on participants’ actions. The bands typically move, calculating the lowest and highest values of a particular number of price candles. When someone uses this concept or technical indicator to generate trade ideas on crypto-assets, those are crypto price channel strategies.
Top five tips for mastering crypto price channel strategy
It is always good to follow expert investors’ way of executing trades to increase profitability and reduce risk exposure. This part will list the top five professional tips to use the strategy effectively.
Tip 1. When opening buy positions
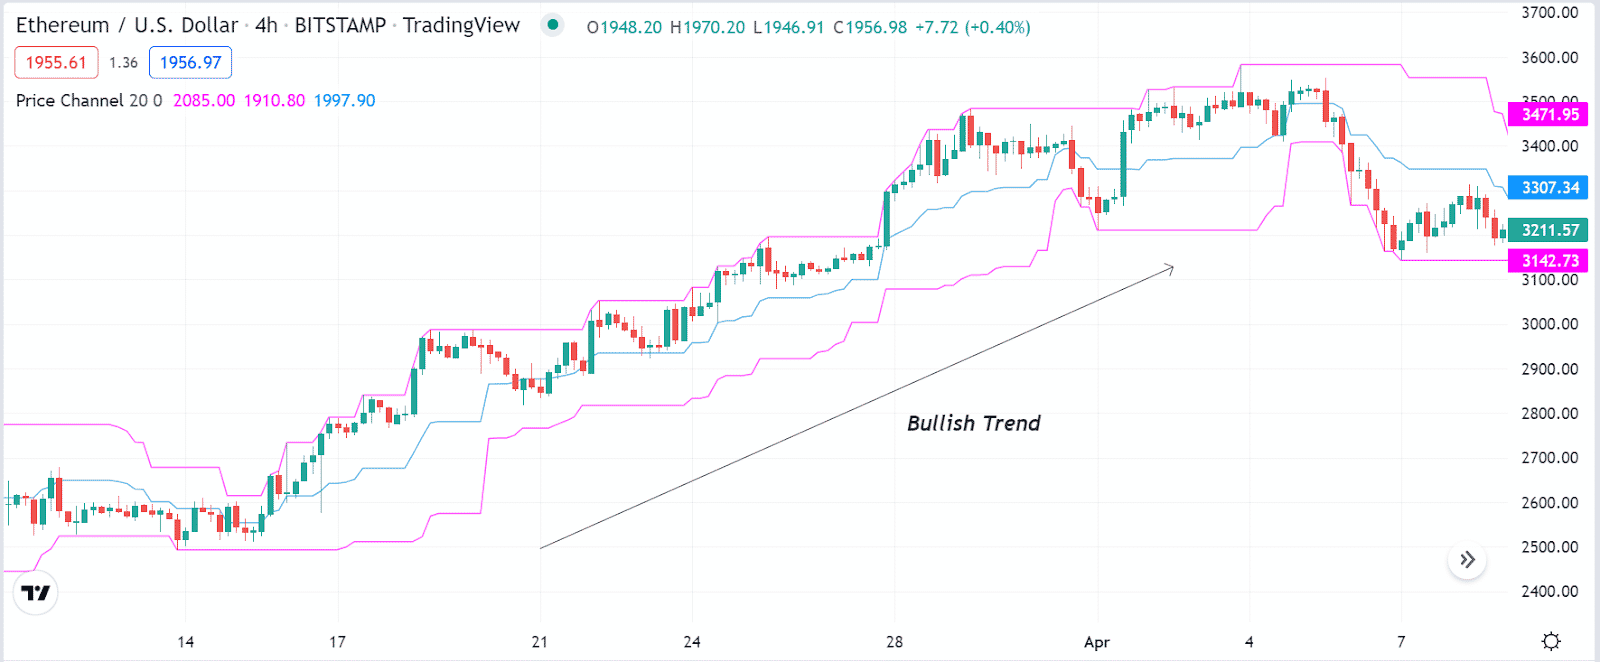
You can use the indicator to open buy positions. In this case, observe the price movements when the price gets near any support level or the finish line of a downtrend. The price crossing the mid-band of the price channel indicator indicates a potential upcoming bullish trend.
Why does this happen?
The bands of the indicator depend on the average price changing of particular numbers of price candles. When the price faces sufficient bullish pressure on the asset price, it breaks above the mid-band range and declares an initiation of the bullish momentum.
How to avoid mistakes?
We suggest opening an initial stop loss below the current bullish momentum when executing buy trades. You can shift your stop loss at the break-even point or above when continuing the buy order, and the price movement creates a new higher high as a part of trade management.
Tip 2. When to enter sell trades
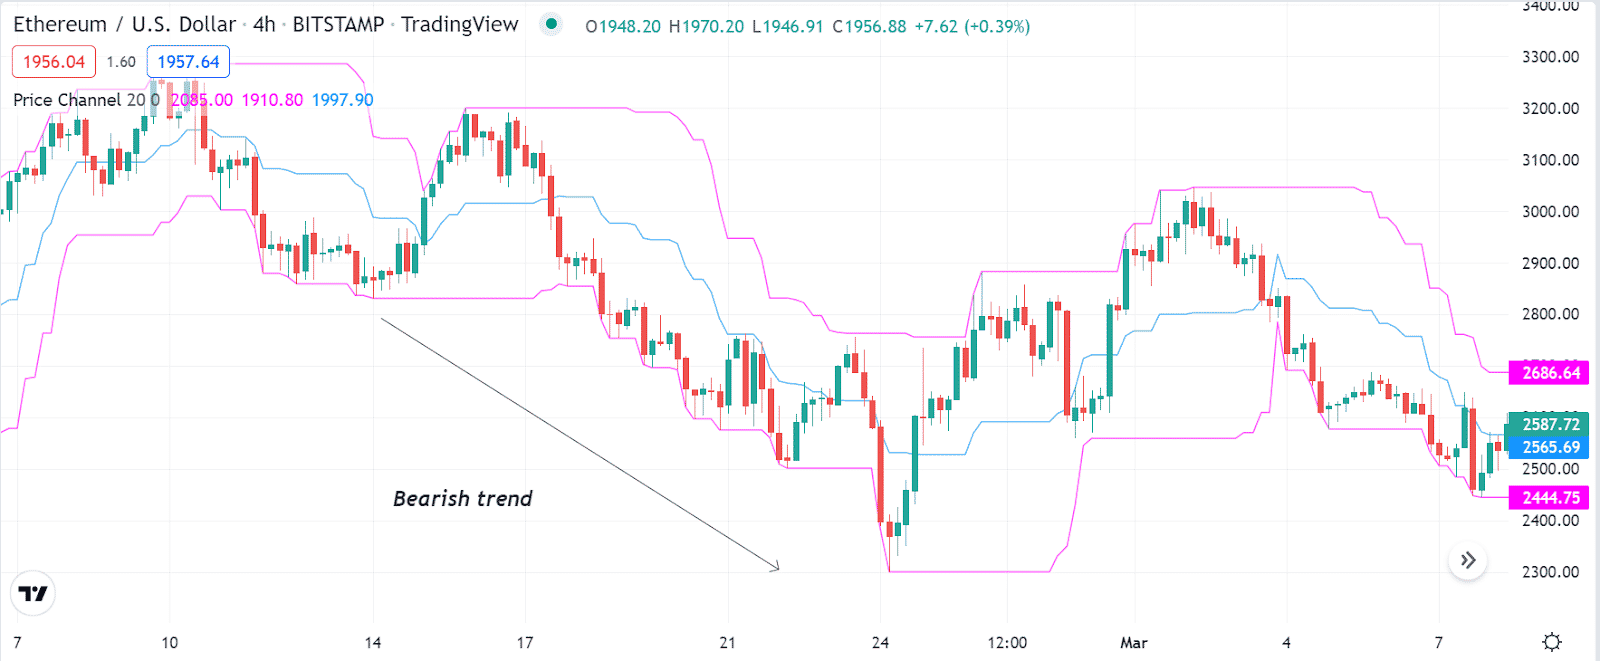
The price channel indicator suggests opening sell positions when the price enters downtrends. In this case, seek opening selling opportunities when the price reaches near a resistance level or the finish line of an uptrend. The price goes below the mid-band, suggesting an upcoming bearish trend.
Why does this happen?
The indicator calculates momentums and suggests swing trading positions. When the price starts declining and comes below the range of mid-band level, indicating decreasing pressure on the asset price.
How to avoid mistakes?
When using this price channel indicator concept to open sell positions, set an initial stop loss above the current bearish momentum. You can continue your sell order as long as the price remains on the bottom channel.
Tip 3. Determine sideways
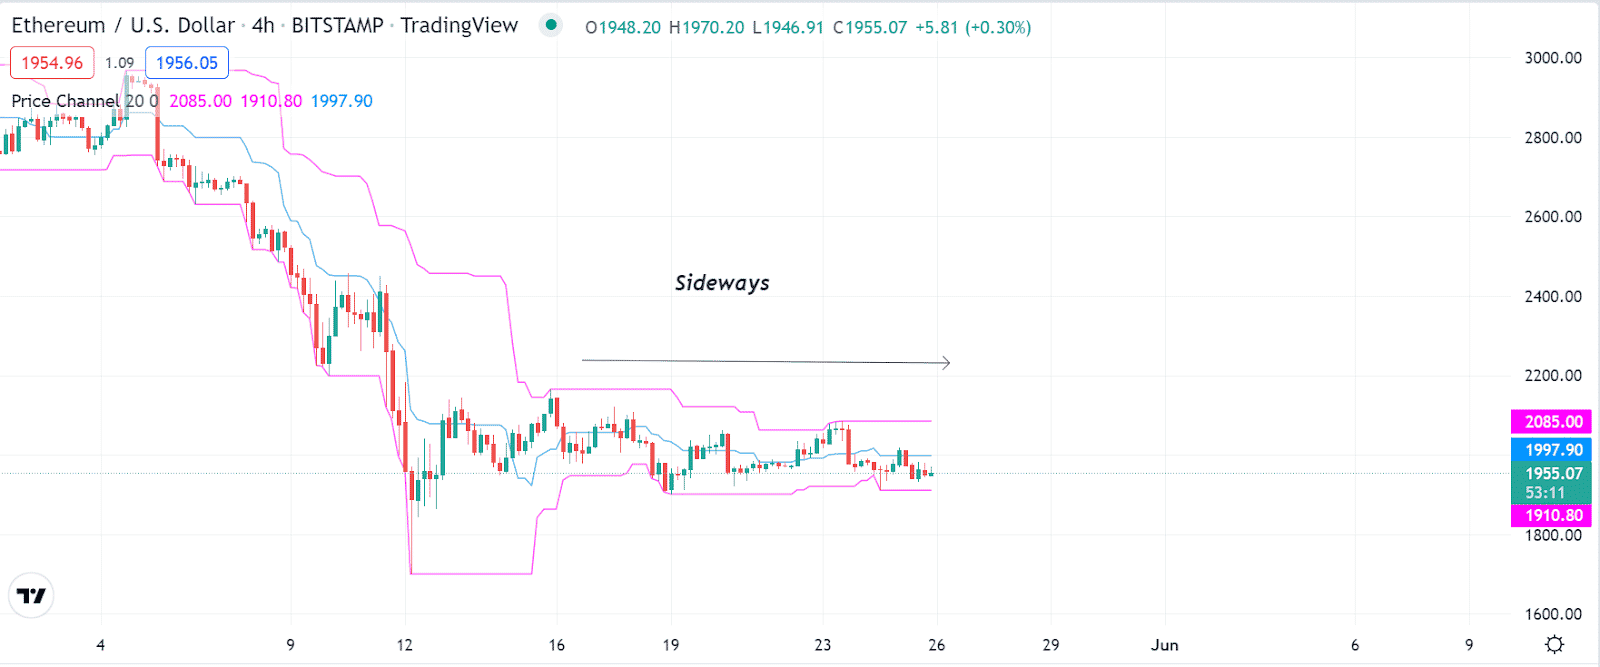
It is essential to detect sideways or consolidate price movements to generate significant profits. You can use the price channel indicator to see lower volume or sideways. In this case, this indicator shows some similarities with the Bollinger Bands indicator as the bands get closer.
Why does this happen?
The bands get closer to this technical indicator as the price enters a ranging phase or loses direction. When the volume decreases, the average price movements get closer, so each band comes together depending on the market context.
How to avoid mistakes?
It is common among financial investors to avoid sideways. We suggest when you mark sideways, wait till a significant breakout occurs in any direction, as in most cases, the price movement creates significant trends after sideways. Moreover, we suggest checking upper timeframe charts to confirm the actual trends before executing any trade if you are a short-term trader.
Tip 4. Combining the volume indicator
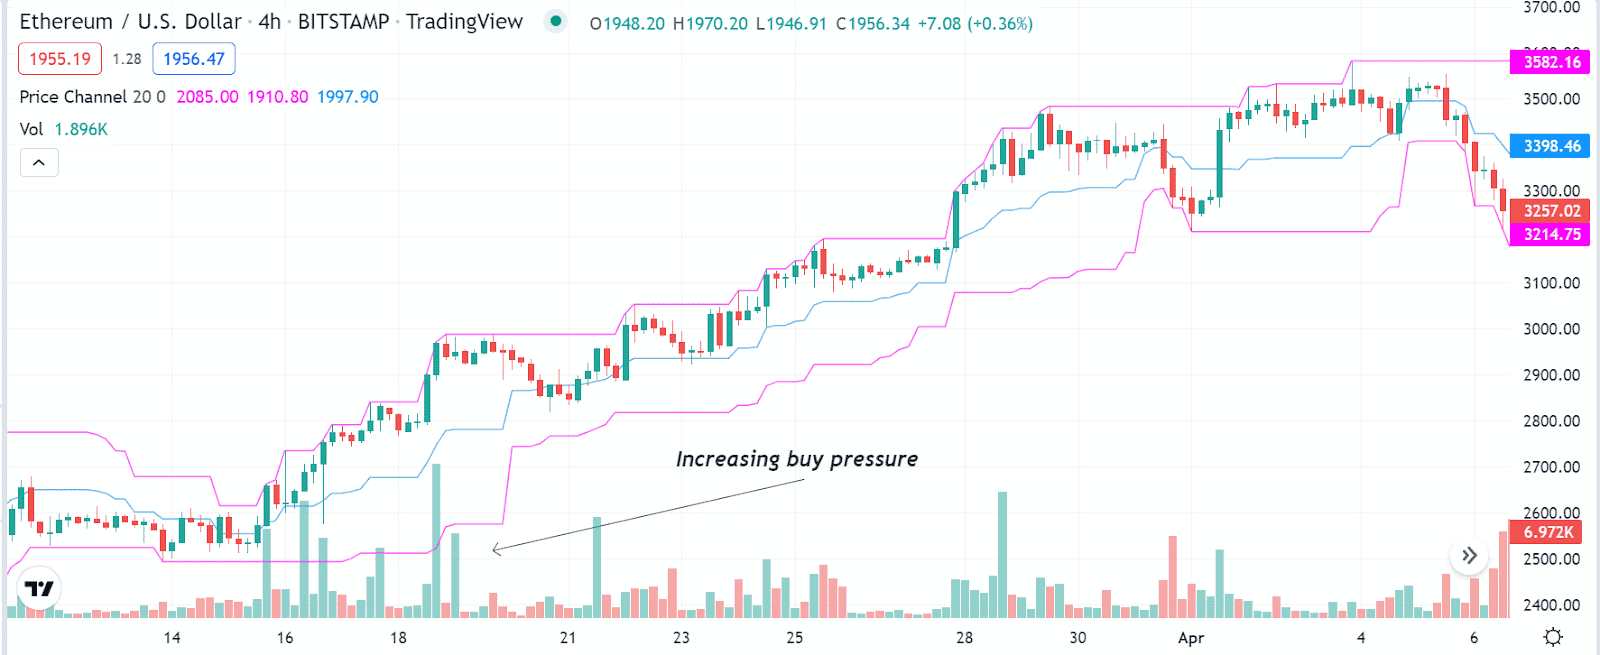
You can combine other technical indicators or tools with the price indicator to identify profitable trading positions. You can use the volume indicator to find effective trading positions. For example, the price reaches above the mid-band of the price channel indicator, and the volume indicator declares increasing buy pressure enables buying opportunities on any particular asset.
Why does this happen?
When both indicators suggest a particular price direction, it becomes easier to execute profitable trades. In this case, the indicator indicates a specific price direction, and the volume indicator confirms the increasing volume in either direction.
How to avoid mistakes?
Combine both indicators readings carefully before entering any trade. If you seek opening positions in short-term timeframe charts, we suggest checking upper timeframe charts to confirm the price direction.
Tip 5. Combining the RSI indicator
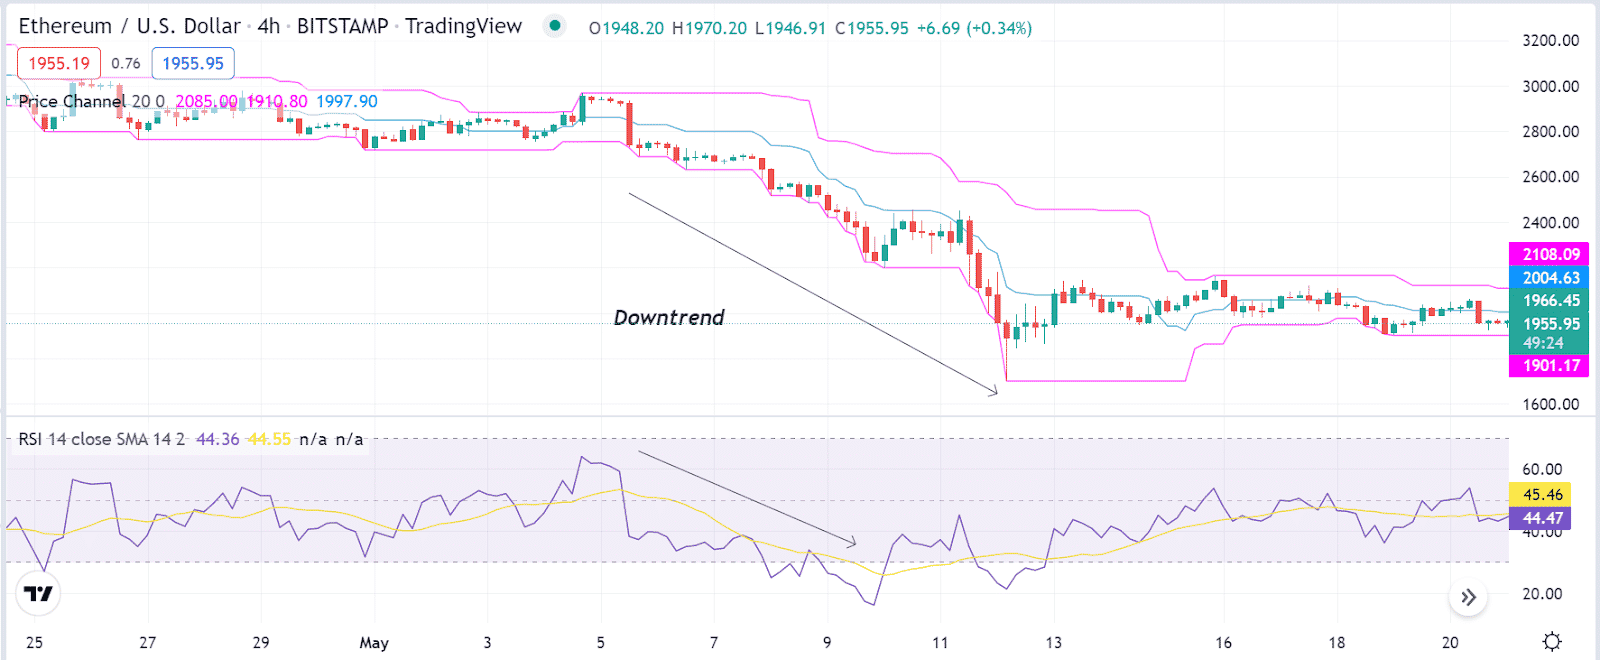
The RSI indicator is a valuable and familiar technical indicator to financial investors. You can use the RSI indicator as a supportive indicator alongside the price channel indicator to generate trade ideas. For example, the price reaches below the mid-band of the price channel indicator, and the RSI dynamic line remains near the mid (50) level heads on the downside, declaring declining pressure on the asset price.
Why does this happen?
Both effective indicators suggest a particular direction using different calculations enables identifying efficient trading positions.
How to avoid mistakes?
Don’t make early entries; confirm both indicators readings before entering trades. Moreover, use proper stop loss for any executing trade.
Final thought
Finally, the price channel indicator is an effective technical indicator that applies to many trading instruments. There are many other technical indicators and tools that you can combine with this technical indicator to create sustainable trading strategies, including MACD, parabolic SAR, Fibonacci Retracements, support resistance, etc.


