The SSL indicator provides a clear visual of asset price by combining moving averages of different calculations. This unique technical indicator is an efficient tool in crypto trading and is available on many crypto exchange platforms. So it makes sense crypto investors often seek trading positions using the SSL indicator.
However, it is mandatory to learn the components and the effective using procedure of aunty technical indicator while seeking to generate trade ideas through that trading indicator. In this article, we will dive down into this tool.
What is the crypto SSL indicator?
Semaphore signal level indicator uses two moving averages of the same parameters. One of them calculates from the high, and another calculates from the low price. In that case, two MA lines make crossovers between them depending on the market context and show alerts to indicate the future price movement. The default value this indicator uses is 14.
This indicator is so straightforward that crypto investors use this indicator frequently while making trade decisions. The best time frame to use the SSL indicator is the H4 to D1 chart. However, it is mandatory to follow specific guidelines while expecting to get the best results like expert crypto investors.
Top five tips to earn through crypto SSL indicator strategy
This part will list the top five tips for effectively using the crypto SSL indicator.
Tip 1. When entering a bullish trade
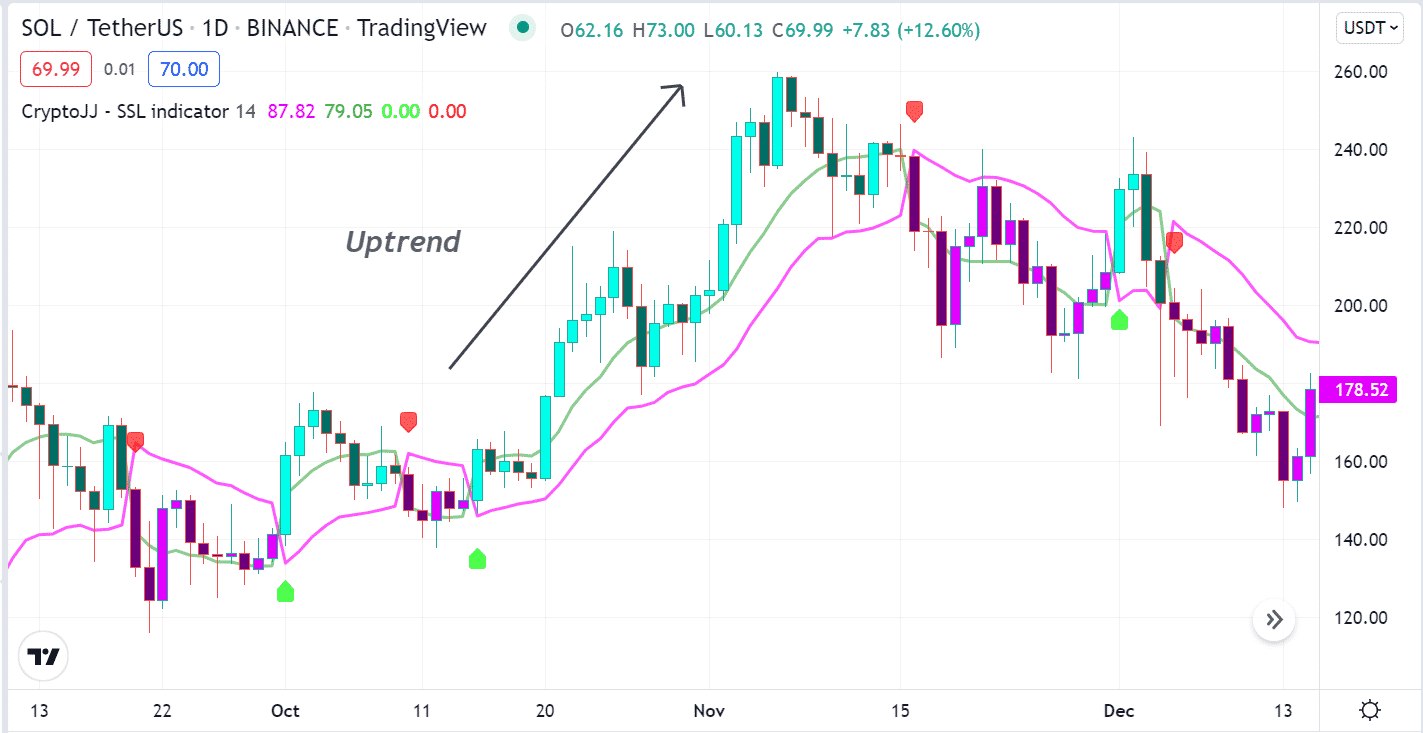
When you seek to open a buy position using the SSL indicator, observe the reading as it shows a green alert arrow below price candles, declaring bullish pressure in the asset price. It is so simple to open a buy position using the crypto SSL indicator as it shows alerts when the price turns in any direction.
How does this happen?
The indicator detects the price entering a bullish phase through its calculation. When the price closes above both MA lines and both MA lines’ heads on the upside declares a positive force on the asset price. Moreover, the bullish crossover between these two MA lines confirms the price direction.
How to avoid mistakes?
When entering buy trades in lower time frames using the SSL indicator, it is worth checking upper timeframe charts to confirm the price direction. Moreover, proper stop loss for your open positions and checking on fundamental info will enable you to make the right trade decisions.
Tip 2. When entering sell trade
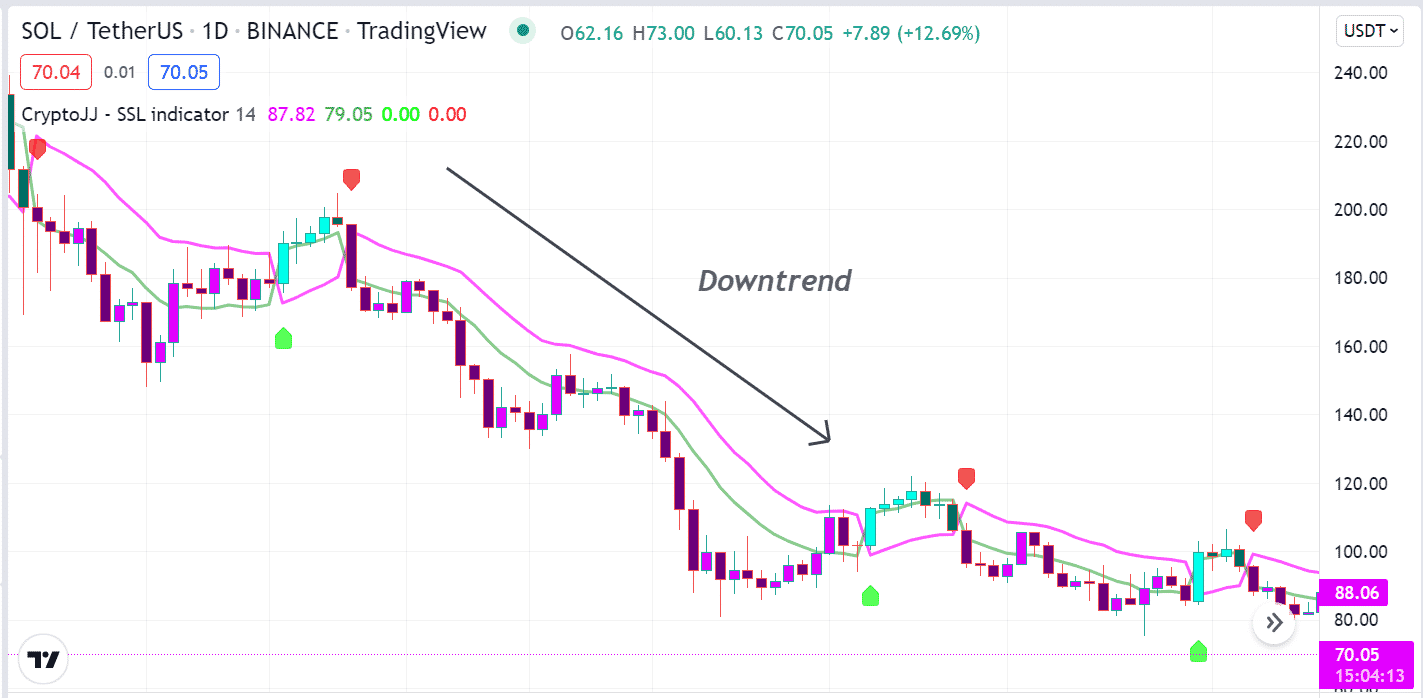
When seeking to open sell positions using the SSL indicator, spot a red alert arrow above price candles as it declares declining pressure on the asset price. The price finishes a bullish trend and starts to decline. You can find the red alert on the SSL indicator.
Why does this happen?
As the price enters a downtrend, the bearish crossover occurs between the two MA lines, and the red alert appears. The indicator calculates the market context to visualize the current condition and predict the future movement.
How to avoid mistakes?
When entering buy trade on lower time frame charts, don’t forget to check upper timeframe charts to match the price direction. Moreover, define an approx. profit target before entering a trade and must use considerable stop loss to reduce risk on trading capitals.
Tip 3. Defining sideways using the SSL indicator
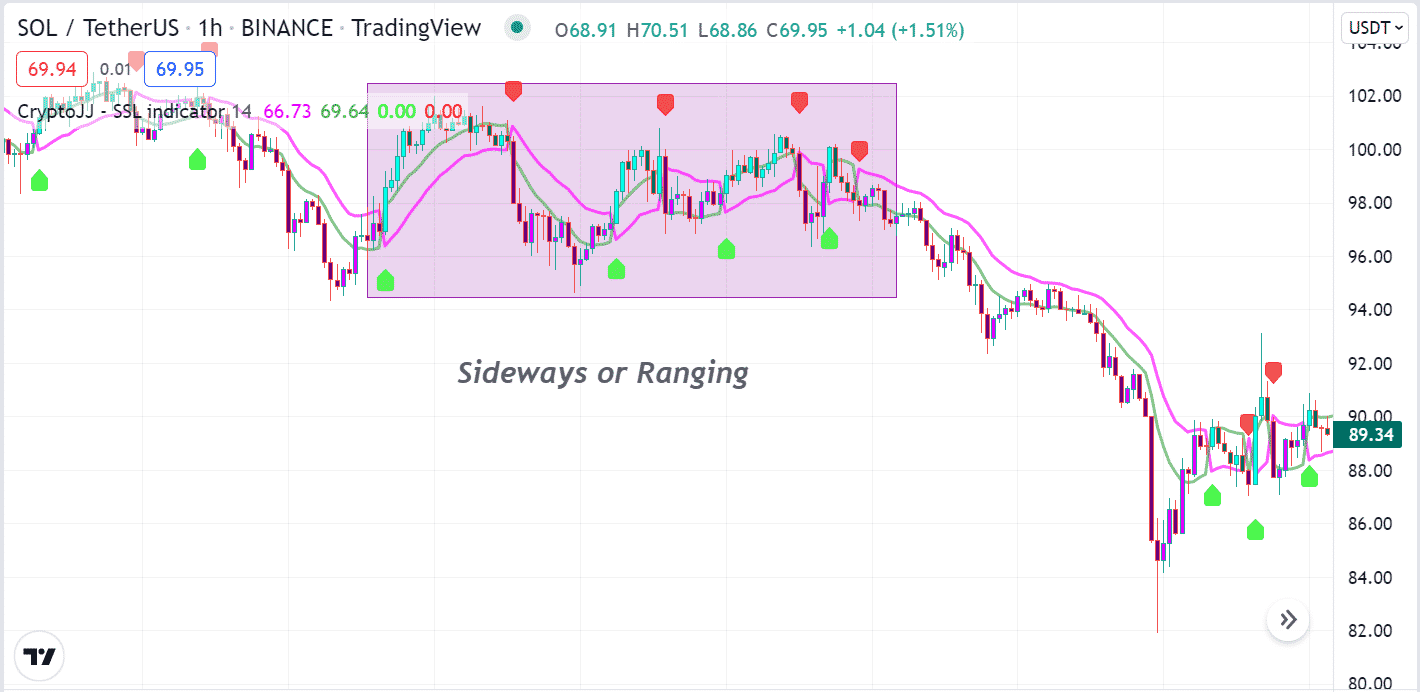
You can use the indicator to determine sideways as identifying low volatile or consolidation phases enable investors to make enormous profits. When the SSL indicator frequently creates green and red arrows, it declares that major participants may lose interest in that asset.
How does this happen?
It happens as there are frequent crossovers between the MA lines of different parameters. The low and high prices get closer as the volatility decreases. So it makes sense that different arrows keep appearing due to these smaller price movements.
How to avoid mistakes?
Smart crypto investors avoid sideways entering the market rather than using the readings to seek better buying/selling opportunities.
Tip 4. Determine breakouts using ADX
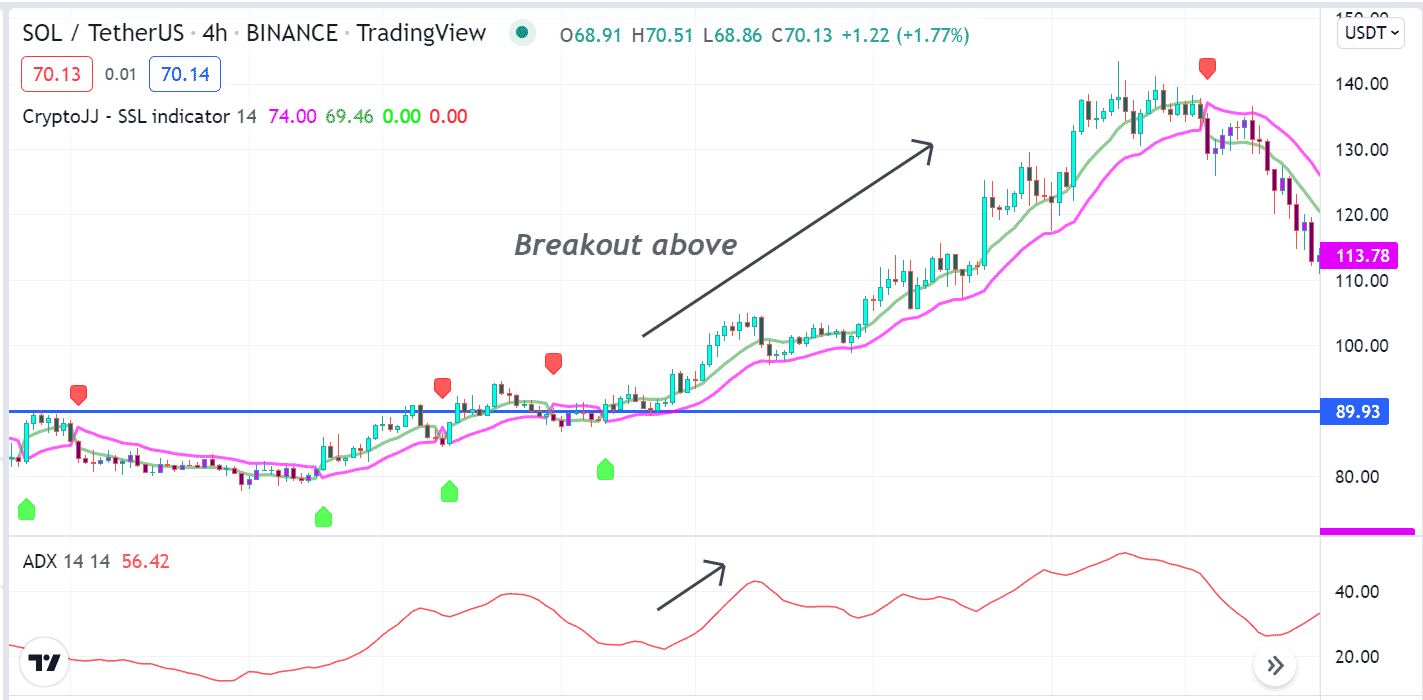
If you have basic knowledge of support resistance, you can determine the breakouts by combining the SSL indicator readings with the ADX indicator. For example, the price breaks above a certain resistance. In the meantime, the SSL indicator creates a green arrow, and the ADX value rises above 20, declaring a breakout above the resistance level.
How does this happen?
The SSL indicator declares a positive force on the asset price, and the ADX indicator confirms the current trend’s strength.
How to avoid mistakes?
When determining support resistance levels, consider upper timeframe chart levels, historical levels, price action levels, etc. Don’t enter trades early, be aware of fakeouts and check fundamental status before executing any trade.
Tip 5. Combining the RSI indicator for efficiency
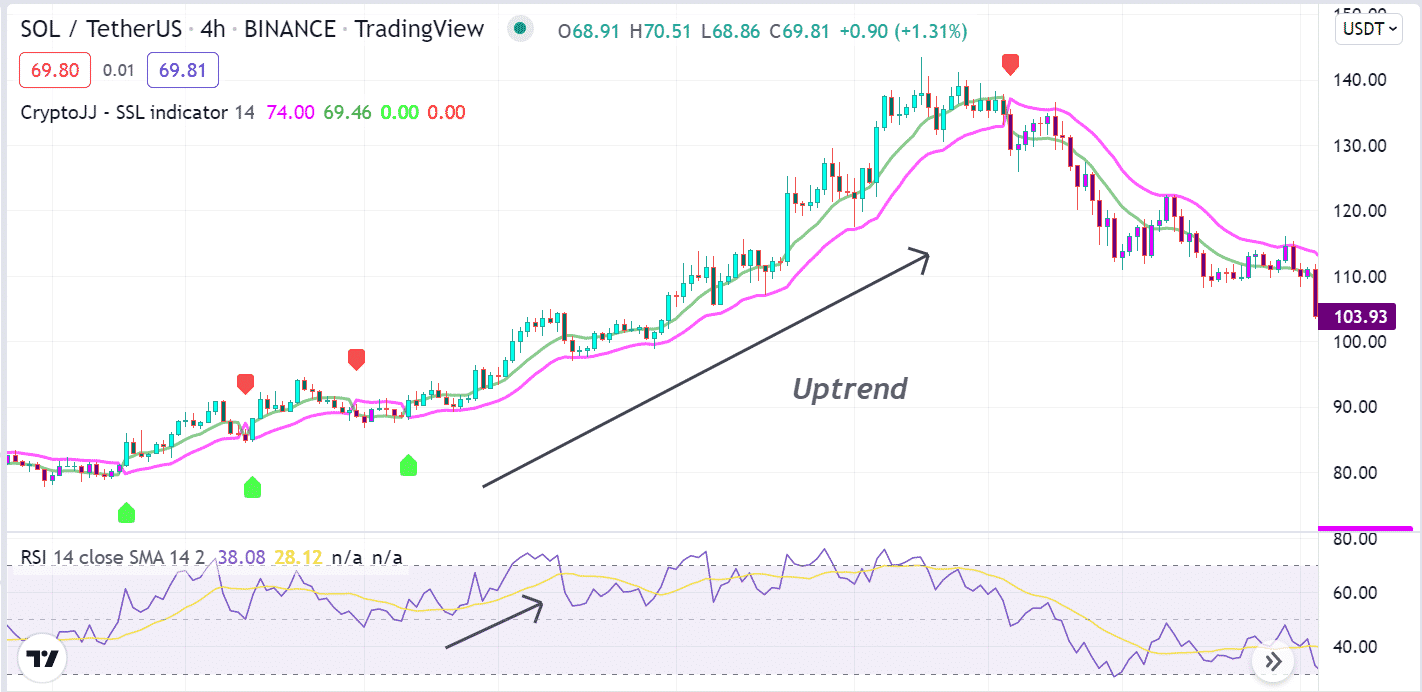
You can execute more efficient trades by combining the RSI indicator readings with the SSL indicator. For example, the SSL indicator may suggest initiating a bullish movement through its green arrow. Meanwhile, the RSI dynamic line may stay above the central (50) level heads on the upside. Both these indicators suggest that the price movement in any direction suggests opening most potential trades.
How does this happen?
We declare these trade suggestions as most potent by combining both indicator readings as different indicators use different calculations of the price movements. So when combining various market info and marge them effectively, you must get the most efficient results.
How to avoid mistakes?
When combining two or more indicator readings, you must cross-check and confirm both readings. Moreover, check the fundamental facts and conduct a multi-time frame analysis to ensure the market context.
Final thought
Finally, these tips are professional suggestions for crypto investors who seek to use the SSL indicator to determine successful trading positions. Using these concepts, you can execute enormous profitable trading positions in any crypto asset.
We suggest following acceptable trade and money management rules in your live trading accounts when using this indicator or concept. You can use many other technical indicators, including MACD, Parabolic SAR, Bollinger Bands (BB), etc., to combine with the SSL indicator to create sustainable trading strategies.
