Many candle formations are typical in the financial market that generates the same trading signals every time they appear during different price movements. It has been common among forex traders to rely on candlestick patterns while seeking trading positions. Many professional forex traders follow the Diamond pattern as a subsidiary of successful trading methods.
However, executing trades depending on any pattern requires identifying that pattern at the exact places where it generates the most potent trading signals besides combining it with other market contexts. This article will introduce you to the Diamond pattern, which also contains successful trading methods using this pattern.
What is the Diamond pattern forex strategy?
Understanding any trading strategy requires learning pattern formation first. The Diamond pattern is a rare formation of price candles that generate signals for upcoming bullish and bearish reversal momentums by appearing in various phases of price movements. This pattern has a rectangle shape whose size may vary and may not always be ideal.
There are usually two Diamond patterns:
- Top
- Bottom
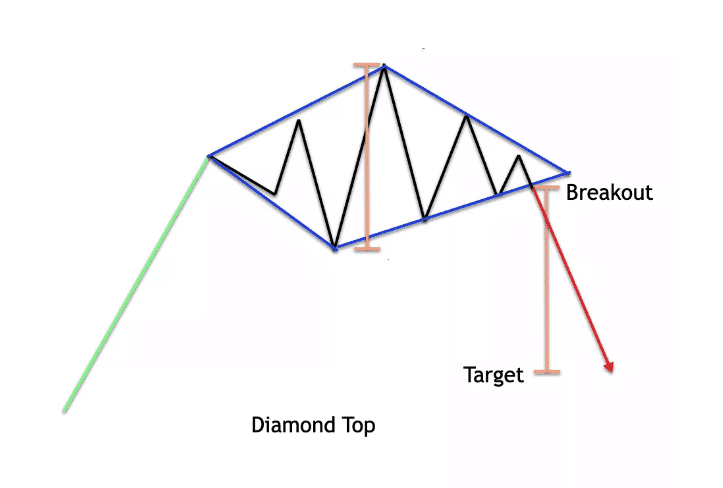
The Diamond top
This figure shares similarities with the head and shoulders pattern of another popular candlestick pattern. Although both generate upcoming declining pressure on the asset price, the Diamond top has a “V” shape neckline, and breakout occurs in the Diamond pattern earlier.

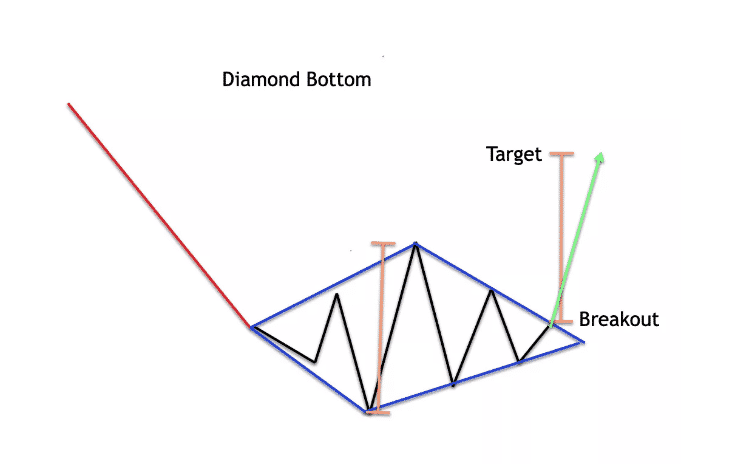
The Diamond bottom
This figure may share similarities with the inverted head and shoulders pattern, and both signal upcoming bullish price movement by appearing near the finish line of a downtrend. The Diamond bottom has an inverted “V” shaped neckline, and the breakout occurs earlier.

Any forex trading method that uses these patterns to generate trade ideas will be a Diamond pattern forex strategy.
How to trade with Diamond pattern forex strategy?
The initial step is to identify any pattern correctly to make trade decisions. While the figure completes the formation, wait for the breakout to enter the marketplace.
The Diamond top will be at the finish line or near the resistance level. When the price breaks below the pattern range, it will generate a sell signal. Conversely, a Diamond bottom pattern generates a buy signal when the price breaks above the pattern range. It is wise to use other technical indicators and tools combining this pattern to create a complete and sustainable trading method.
For example, you may use a volume indicator when the price breaks above the Diamond bottom range; check the volume indicator reading. If it shows an increasing buy pressure on the asset price, it may initiate bullish momentum.
In our trading method, we use the volume indicator and the VWMA indicator (periods of 20).
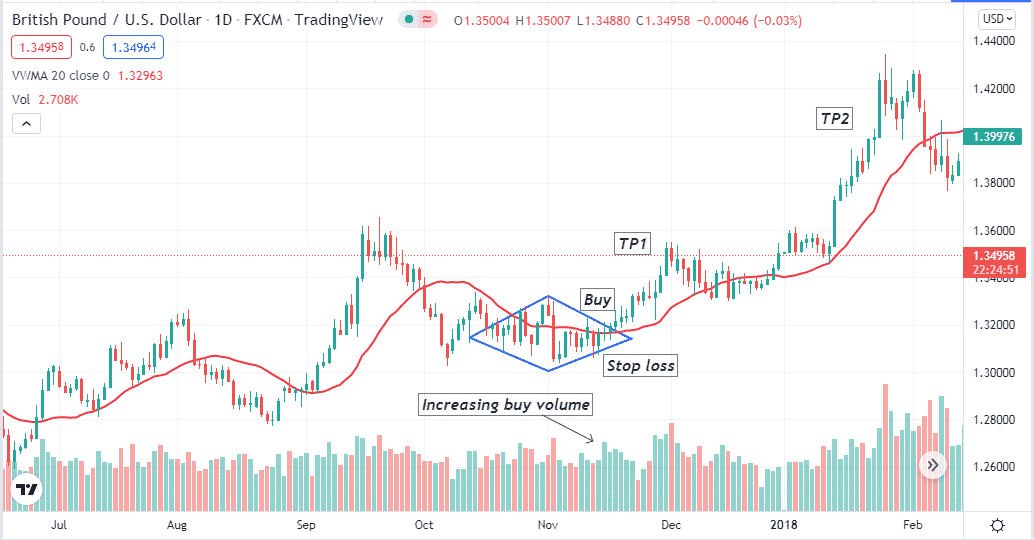
Bullish trade setup
When you seek to open buy positions, then follow the guidelines below:
- Spot a Diamond bottom pattern near the finish line of a downtrend.
- Wait till a breakout occurs above the Diamond bottom pattern range.
- After the breakout, check the price remains above the VWMA signal line.
- The volume indicator shows an increasing buy volume.

Entry
When the scenarios above match your target asset chart, it signals a possible upcoming bullish pressure on the asset price. According to this trading method, it is the potential place to open a buy position.
Stop loss
The reasonable stop loss level will be below the range of the Diamond bottom pattern. For accuracy, place a stop loss below the last low inside the pattern range.
Take profit
The initial profit target will be equal to the size of the pattern formation. For example, if the Diamond pattern range has 200 pips in total, the initial profit target will also be above 200 pips from the breakout point. You can continue the buy order till the bullish momentum lasts. Close the position when sell volume increases or the price comes below the VWMA line and continues to decline.
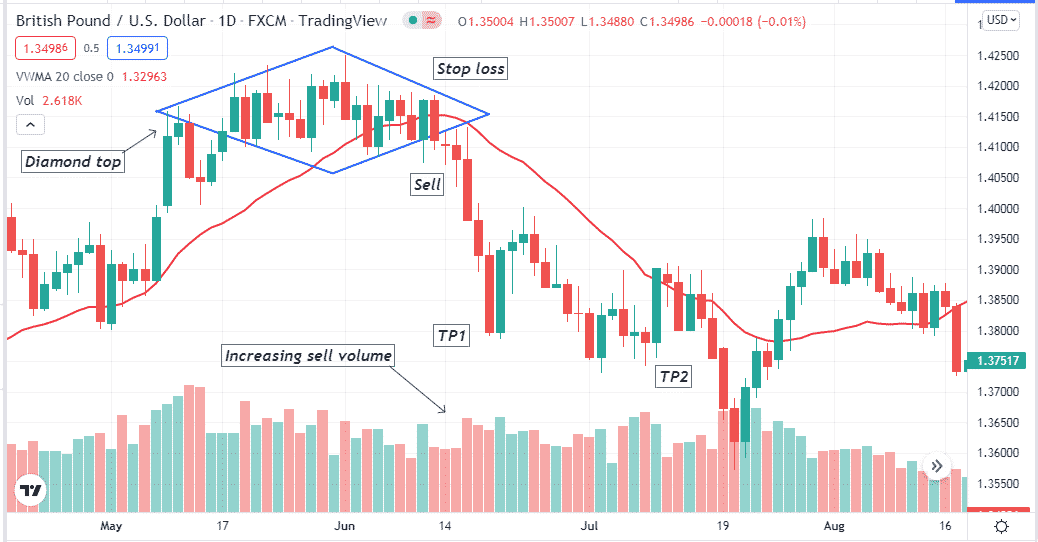
Bearish trade setup
When seeking selling opportunities, follow the guidelines below:
- Spot a Diamond top pattern near any resistance line or after an uptrend.
- Wait till the pattern completes formation and breakout below.
- The price breaks below the pattern range check indicator readings.
- The price remains below the VWMA signal line.
- The volume indicator declares increasing sell pressure.

Entry
When these conditions above match your target asset chart, it signals a possible upcoming declining pressure on the asset price. Place a sell order.
Stop loss
The initial stop loss level will be above the last high within the Diamond top range.
Take profit
The initial profit target will be below the same distance below the breakout as the Diamond top formation size. For example, if the Diamond top has a range of 150pips, the initial profit target will be below 150pips from the breakout level. You can continue the sell order till the price movement remains bearish.
How to manage risks?
The forex market remains unpredictable for many reasons, as the price movements occur in the forex market due to many technical, fundamental, and sentimental contexts. These factors relate to the supply and demand of specific currencies and relative pairs. So risk management is a vital part of forex trading.
While using this trading method, follow some professional risk management tips below:
- Don’t draw the pattern forcefully.
- Wait till complete breakout occurs above or below the Diamond shape. In this case, wait for the entire candle formation outside the pattern range.
- Check the readings from indicators carefully. Don’t enter any trade without confirmation from the indicators.
- Use proper trade and money management while using this trading method. Don’t risk more than you can afford. For trade management, suppose the price reaches the range above or below the candlestick pattern size, and you want to continue the order as the market context is positive. Then shift your stop loss at or above/below the breakeven as a part of risk management.
- Check on fundamental data before entering any trade; avoid trading using this method during major fundamental news releases.
- Try using upper time frame charts or at least multi-time frame analysis. It will guide you to make more successful trading positions.
Final thought
Using the Diamond pattern for trading makes it simpler to identify trend reversal points and execute successful trades. This chart pattern involves four limited trendlines. In which two act as support and the other two resistances. Any breakout generates trade signals. Using price oscillators such as the RSI or MACD can increase accuracy in finding potentially profitable trading positions.


