Let it be stocks or forex, trading or investments. Everyone wants to know the candle patterns that work in real-time scenarios. There are many candlestick patterns, and it sometimes becomes overwhelming to decide which one to focus on while trading.
Imagine a scenario where we have an ongoing uptrend for a long time, making it evident that traders look for a reversal and end of the bullish trend. But in the same scenarios, traders will still trade long, anticipating the market will move more up and hence buying the asset. This sentiment which shows the state of confusion and indecision, leads to the formation of the Doji candle.
Doji is one of the most traded candle patterns, giving a very accurate signal for buy and sell if traded correctly. This article will look into the in-depth concept of Doji and how to deal with it effectively.
Introduction to the candlestick
Candlestick is a one-bar presentation of price movement on the trading chart. It pays out a visual representation of price, summarizing essential details that traders and investors need to know at peek while trading.
Candlestick is also known as Japanese candlestick because it first came into existence in the 18th century in japan. Munehisa Homma, a rice trader in Japan, first used the candlestick concept to track rice’s price activity over time. After that, the candlestick chart became highly efficient for traders and investors around the globe of all levels.
A Doji candle is with a wick and minor or no real body. The reason behind such a formation is the market sentiments. Doji formation conveys a sense of indecision between the buyers and sellers.
There are many variants of Doji candles; a few of the common ones are:
- Gravestone
- Dragonfly
- Star
- Long-legged
- 4 price
What is a Doji candle?
Any candle formation is because of the sentiments of millions of people trading at the same time as buyers and sellers. Thus, the Doji is a type of price marking that forms indecision between the buyers and the sellers.
For example, the buyers think the price is too high and should not buy the asset while the seller assumes the market can still go up, and they should not sell the asset.
Common types of Doji candle
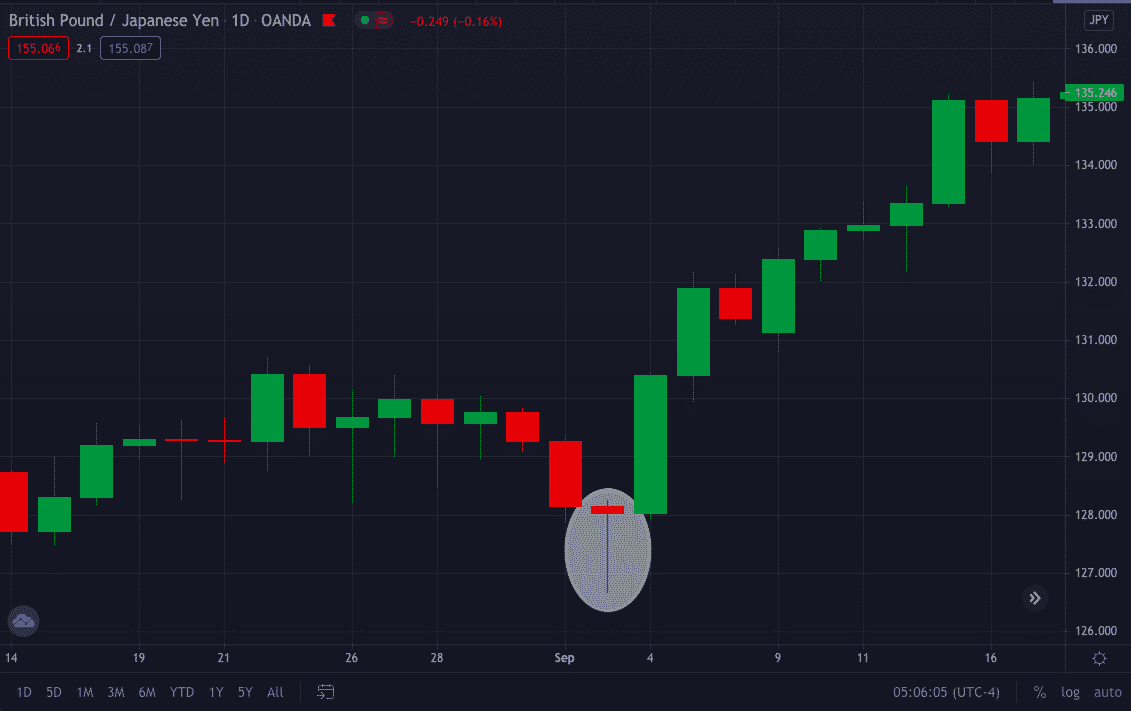
The Dragonfly
This candle has a long shadow/wick at the bottom and no real body and indicates buying pressure in the market. The long wick at the bottom is the evidence of rejection denoting buyers entering the market and weakening selling pressure. This candle mainly occurs at the end of a downtrend or when the price is forming a swing low.
The Gravestone
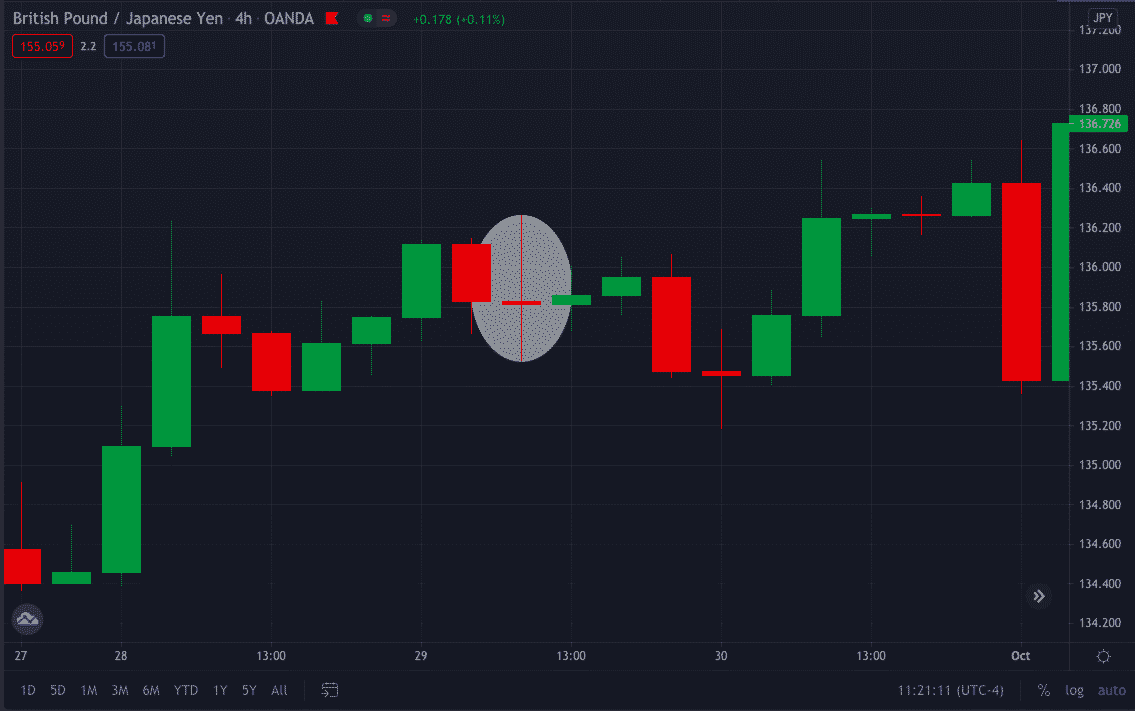
This candle is just the opposite version of the Dragonfly Doji. It has no real body but a long shadow/wick on the top. There might also be a bottom wick but could be very small or absent. Gravestone Doji signifies selling pressure in the market and usually forms at the end of a bull market.
The Long-legged
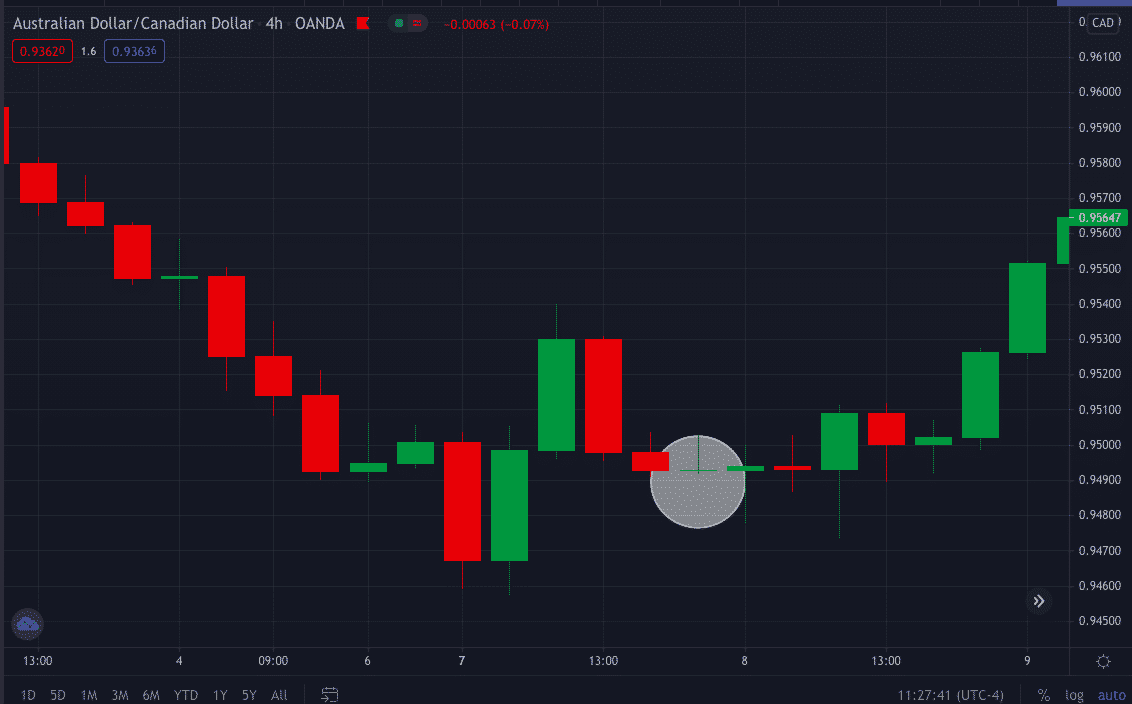
This candle has wicks on the top and bottom with a very small or no real body. The wick on both sides is almost of similar size. When this candle occurs, it shows indecision in the market and says neither the bulls nor bears have their market strength.
Star
This candle is the simplest type of Doji that forms when the market is inconclusive. It could be either bullish or bearish based on the place where it is formed. This pattern is also known as a Morning Star. It started at the bottom of a downtrend to confirm the reversal to an uptrend. Similarly, a bearish candle known as the Evening Star forms at the top of an uptrend to confirm reversal from uptrend to downtrend.
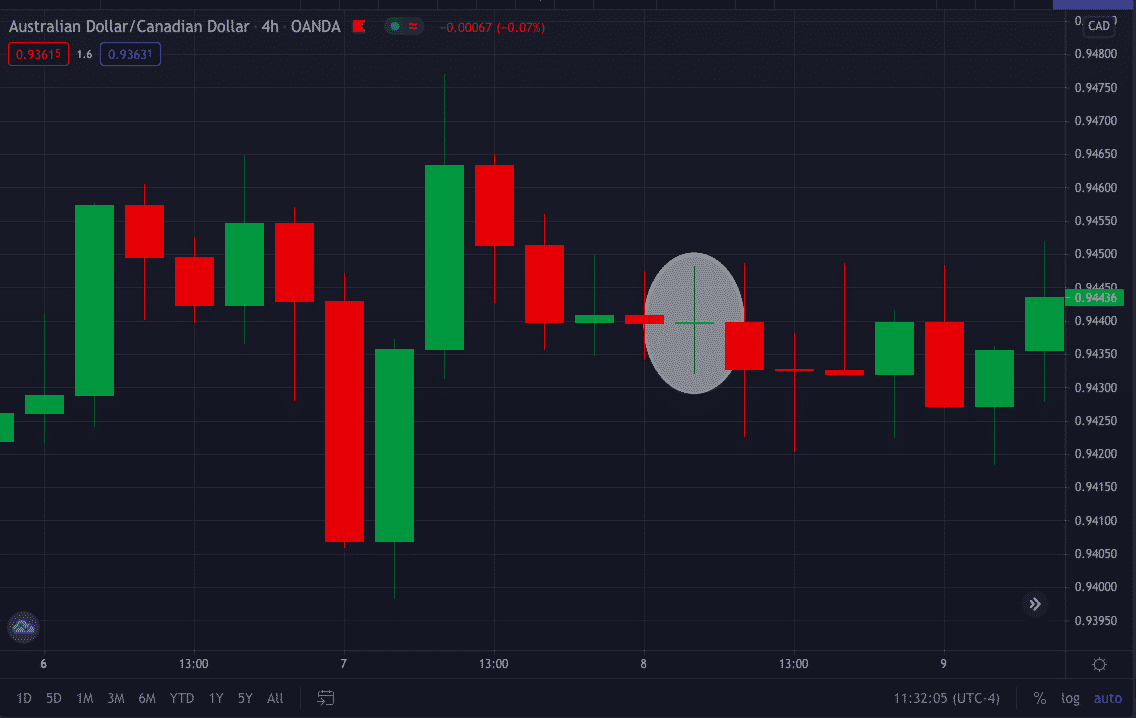
4-price
It is a Doji with the open, high, low, and close at the same price. The occurrence of this candle anywhere in the chart shows that the asset is dealing with less volume and traders/investors are highly indecisive.
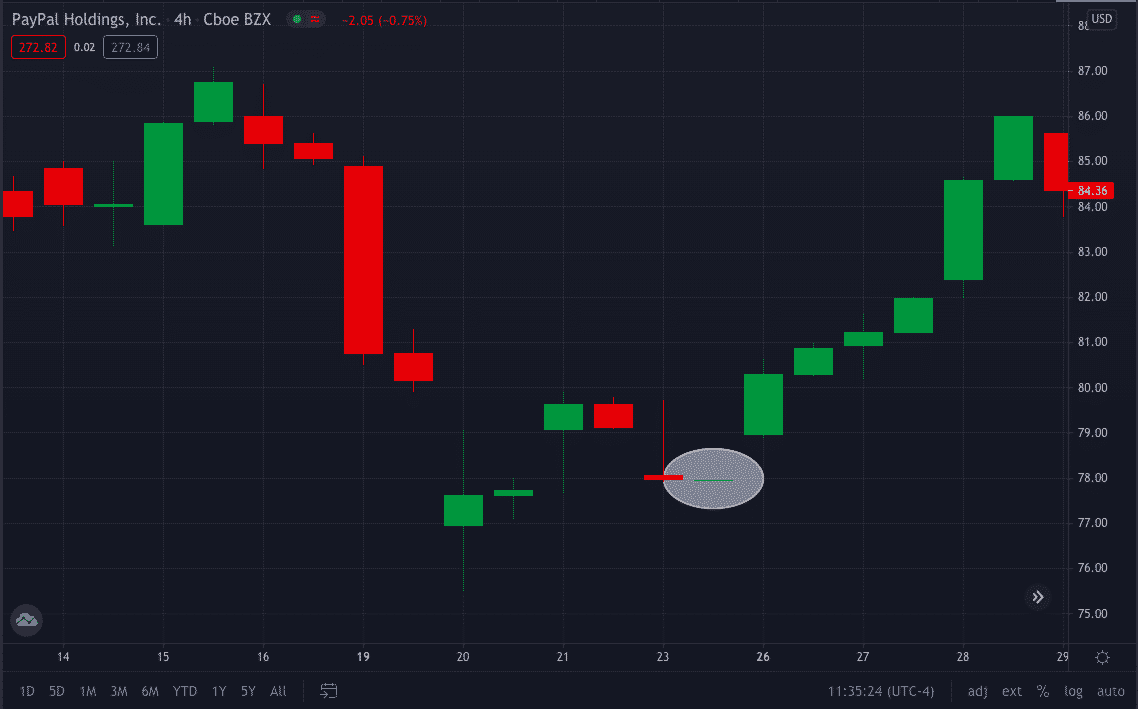
Trading the Doji setup
Doji candle trading is among the most used trading setups for many traders of all styles. However, just knowing about the types of Doji candles and the reason for their formation is not alone sufficient to help you succeed in trading.
You will see Doji candles occurring many times in the chart, but all the Doji are not essential and cannot help you win. Therefore, you must first understand the overall market sentiment, use technical indicators and Doji to confluence high probability winning trades.
Trading the Doji setup within five simple steps:
- Identifying the trend
- Finding the Doji setup
- Trend trading with Doji
- Using the technical indicator
- Managing risk
Identifying the trend
It is always essential to take the trade in the direction of the trend. Here to trade Doji candle setup, you first need to make sure in which direction you want to execute your trade.
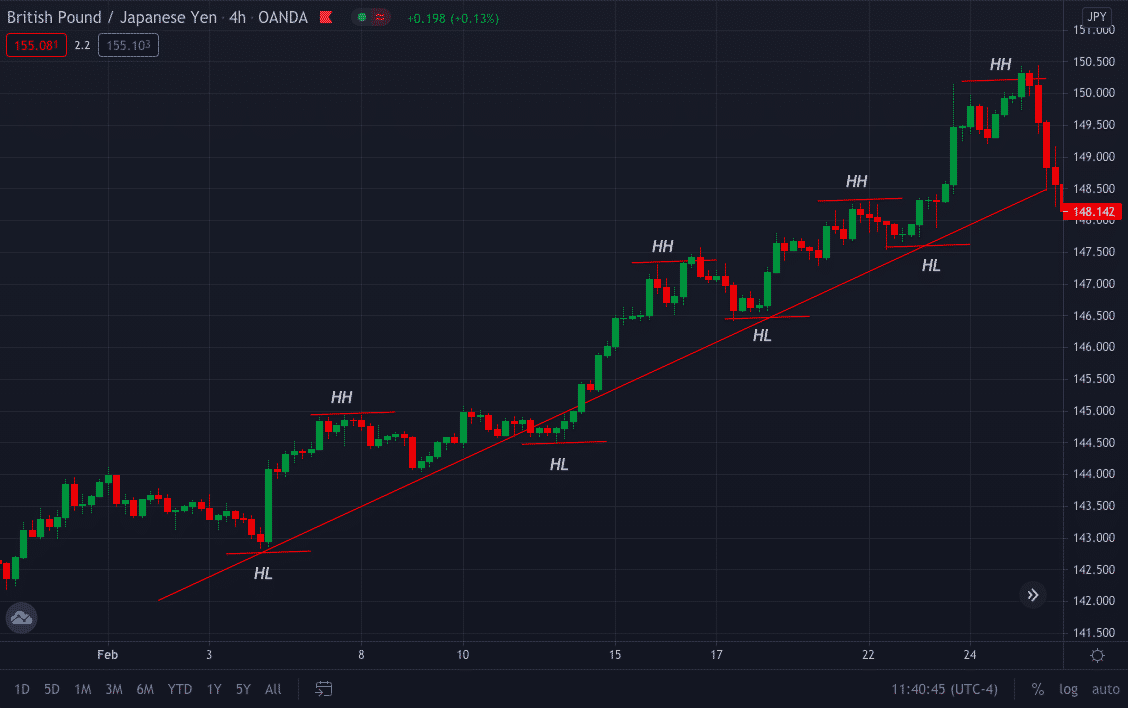
For this step, you can use a top-down time frame or any other trend confirmation indicator. For example, if the prices are making a higher high and higher low, it is a confirmation of an uptrend, while if the price is making a lower high and lower high, it is a downtrend.
Finding the Doji setup
There will be many Doji candles formed on the chart, but trading the Doji setup needs the formation of Doji either at the end of the uptrend or the downtrend.
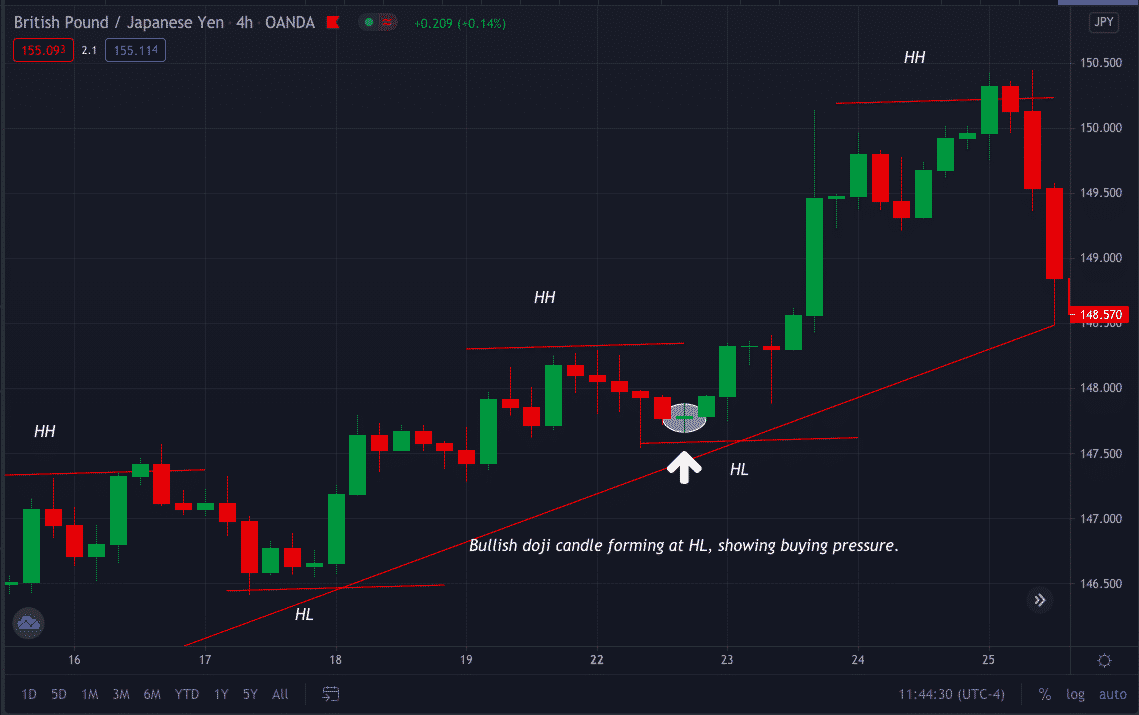
You first need to observe if the momentum of any trend is weakening; for this, you can use multiple candle rejection. Then, moving forward, trading Doji near the support & resistance or trendline gives better trade opportunities.
Trend trading with Doji
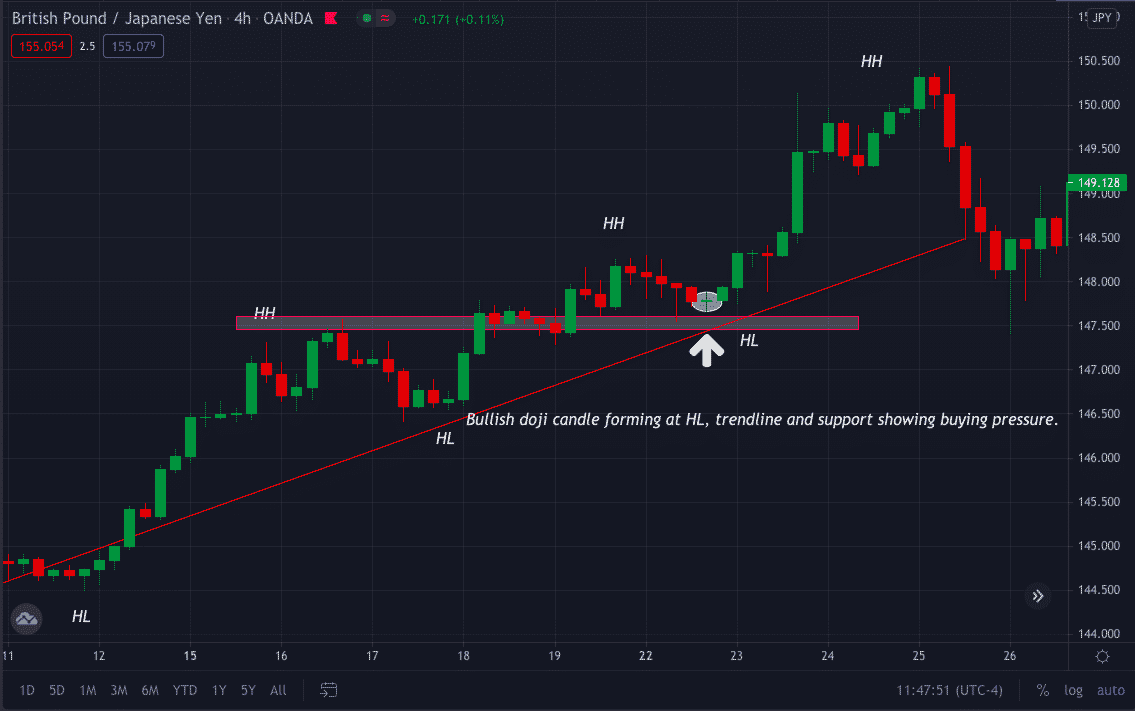
This strategy is trading based on Doji formation near the support, resistance, or trendline. The below GBP/USD chart shows a bullish formation near the trendline, and in addition, it is on the verge of forming a higher high, representing low selling pressure and high buying pressure.
Using the technical indicator
Any trend has to reverse; once an uptrend is getting over, you might see a Doji forming. But you cannot trade this Doji just because it has formed near strong support, resistance, or at the lowest swing. For this, you can take help from different technical indicators.
Managing risk
- You can keep a buy order above the recent Doji high and the SL 10pips below the Doji’s low in a bull market. Similarly, you can keep a sell order for the current low and the SL above the high in a bear market.
- You could either use a trailing stop-loss or put your TP at the next strong support or demand level to exit a trade. Also, it is essential to at least go for a 1:2 risk/reward trade scenario.
Conclusion
Either you are a technical trader who uses indicators or a price action trader who likes trading based on price momentum, the Doji candle has proved to be one of the accurate trade setups. As any single candle or pattern is not alone sufficient to make you win, trading Doji with an area of confluence will add an extra edge to your trading approach.
