Have you ever noticed you did the analysis and think that the price will move in favor, but it goes in the opposite direction, leaving you with wide-open eyes? In this guide, we’re going to break down fake setups in FX and give you four tips on avoiding them.
What are fake setups in trading?
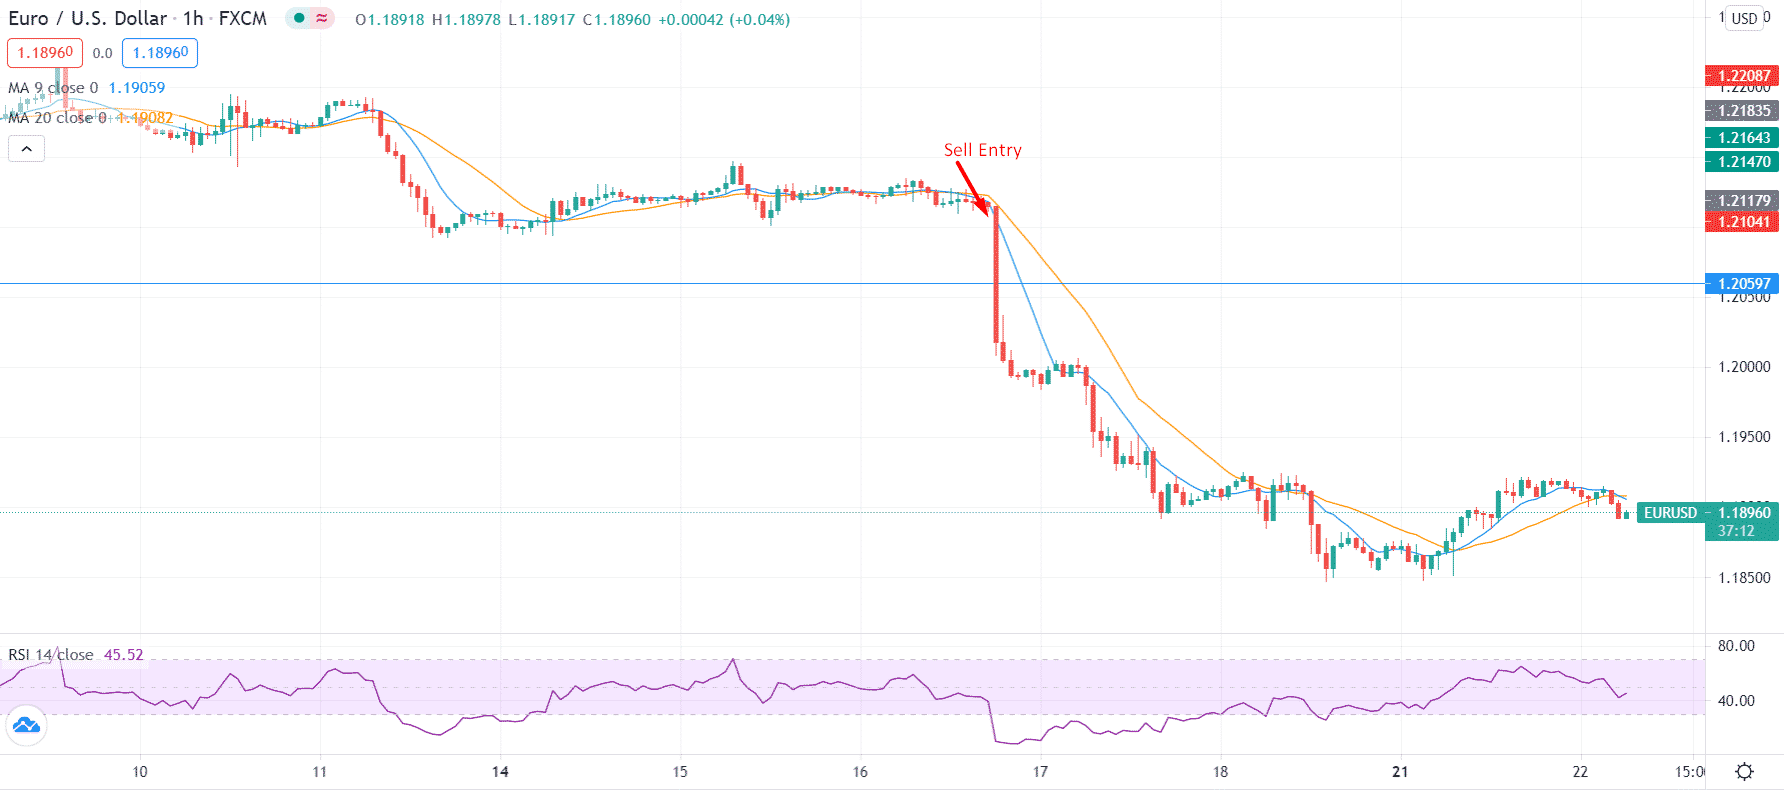
Fake setups are typical in FX trading and describe the situation where you enter into a position in anticipation of catching a big move. But unfortunately, that move never happens, and the pair start moving in the opposite direction. Fake setups are also recognized as false breakouts or fakeouts.
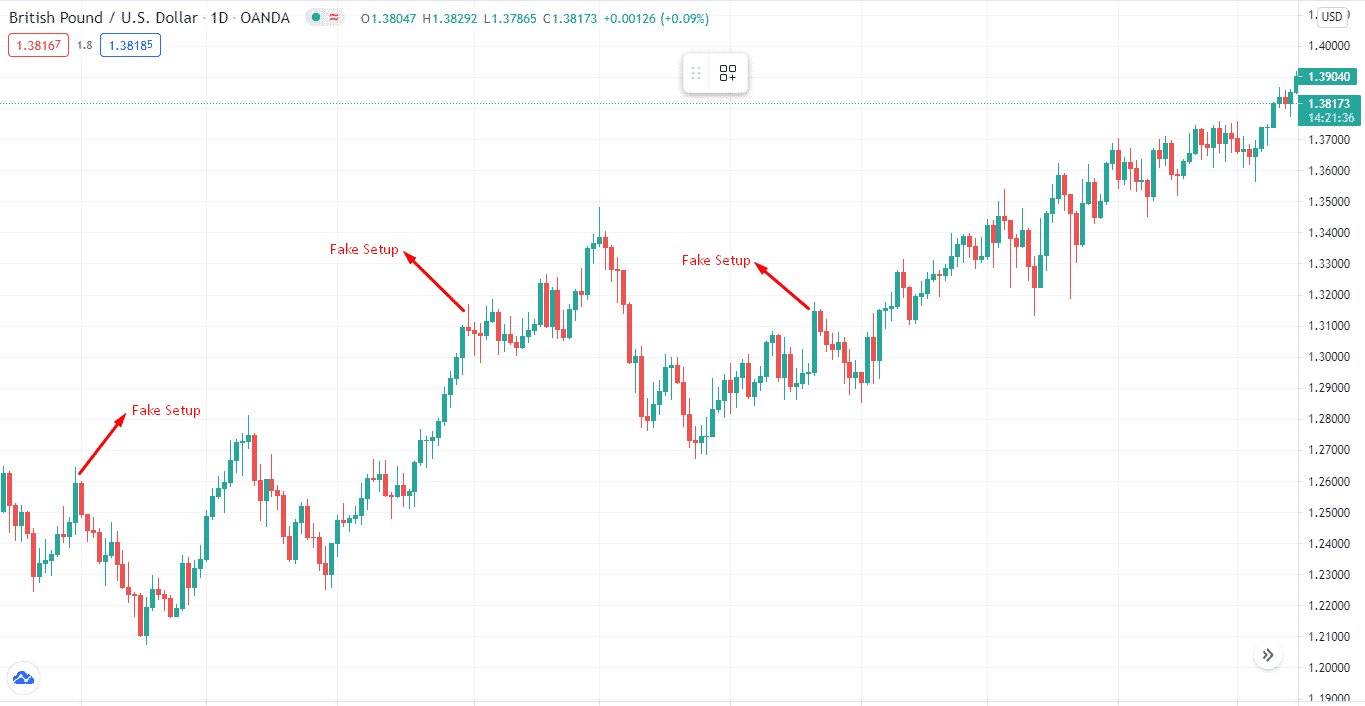
As the above chart illustrates, even though some traders might prefer to take entry points, the market moved oppositely. So this is the worst-case scenario for any trader because you thought you did everything right, but the freaking market moved against you.
How to avoid fake setups?
Avoiding fake setups is not like solving complex algebraic equations. It’s pretty simple.
As you can see on the above chart, rather than acting on a candle, wait for the next candle to appear and enter the trade. As soon as the confirmation candle appears, you wait for it to close and then act on it.
But this approach has a slight problem. For you to wait for the confirmation candle, you have to glue it to the screen constantly. Of course, it isn’t easy to monitor your trading screen continuously. So, how can you avoid fake setups then?
Let’s go through the top four tips on how you can avoid a fake setup.
Tip 1. Backtest your strategy
In FX, strategy’s backtesting means analyzing currency pair’s historical data and comparing it with the trading tactic.
The theory behind backtesting is, “what worked in the past will also work in the future.” So if your strategy worked well in the past, it’d also do well in the future. Let’s make things easier by explaining it on the chart.
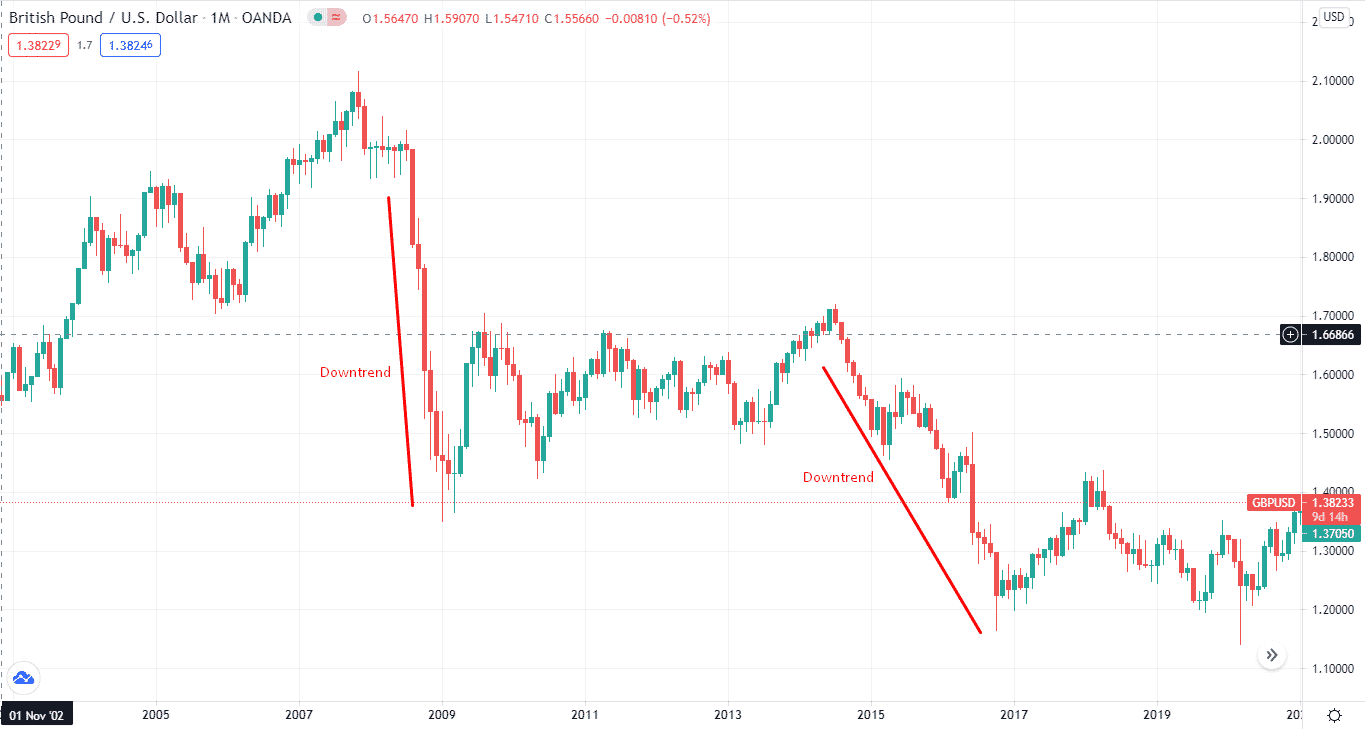
The below chart depicts the GBP/USD downtrends between 2007 and 2009 and in 2014 and 2016. If you backtested your strategy and saw the downtrend of GBP/USD, you would have gone short of GBP/USD in 2014.
Why does this happen?
Several factors like economic data, financial crises, and health crises can move the market, and fake setups can appear regularly.
How to avoid the mistake?
You can avoid fake setups by looking at the historical data of the pair. Once you see a similar kind of trend, you know what position to take.
It’s important to mention that backtesting doesn’t work if you don’t have a good trading plan. Backtesting your strategy without a trading plan is like touching the beehive without a beekeeper suit.
Tip 2. Add time filters
The time frame you choose to trade on matters the most. This makes identifying fake setups a breeze. Let’s explain this on the charts.
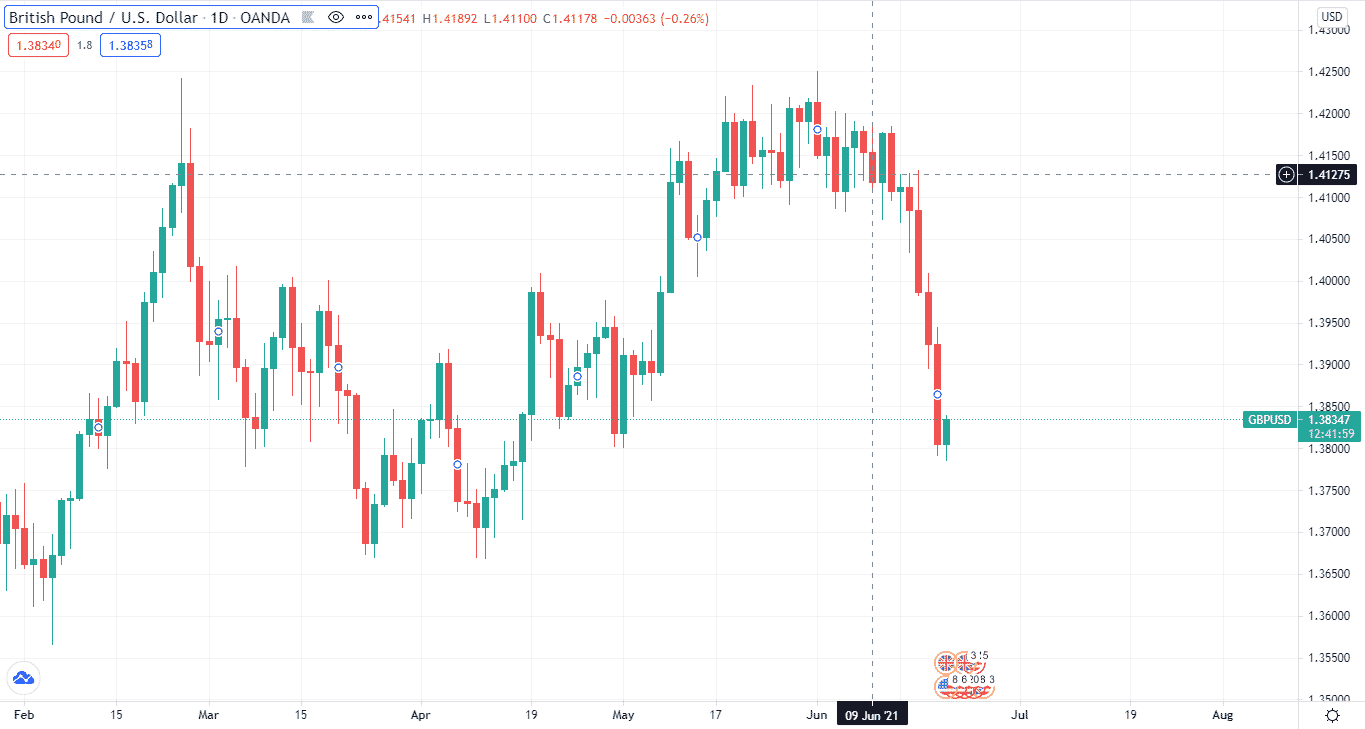
On the above chart, you can see that on June 9, there was a big bullish candle. You might have taken a bullish position, considering this candle. But wait, let’s see what’s on the daily chart. Should you go long?
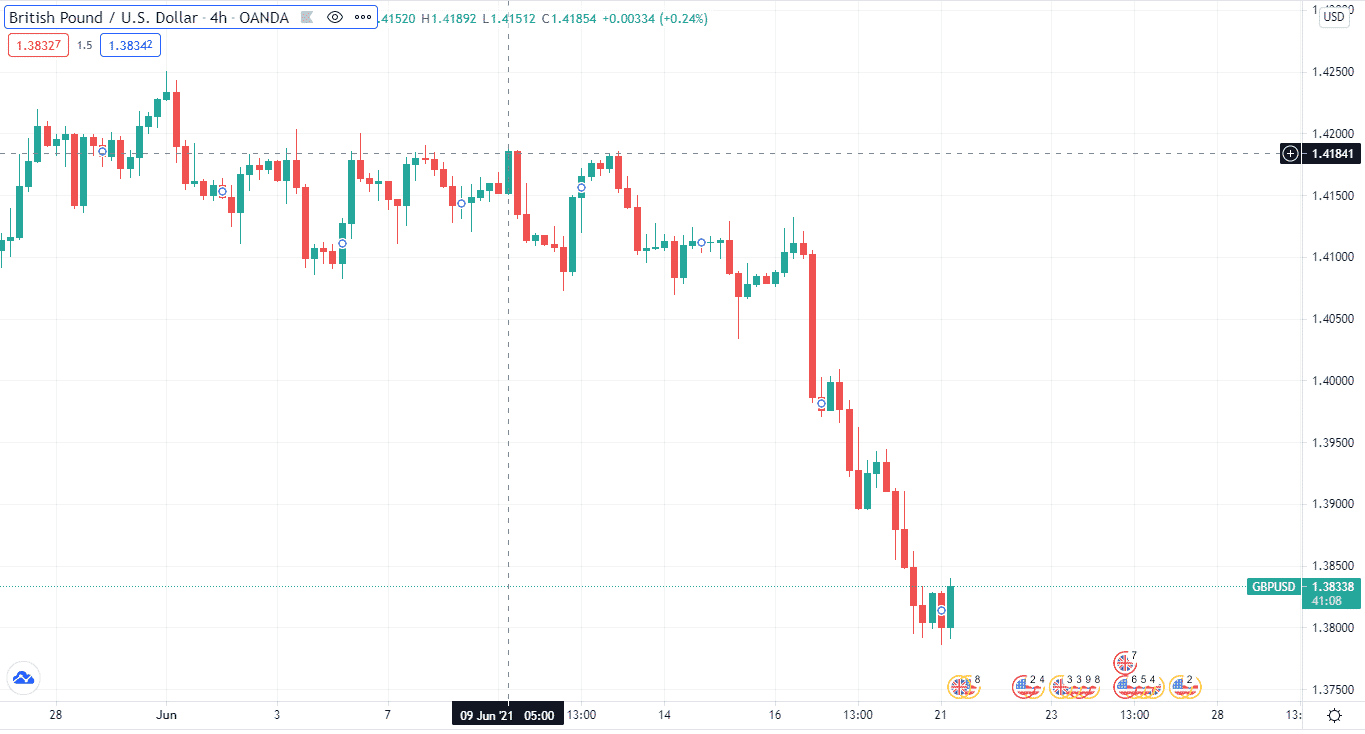
As you can see, the daily candle is bearish. So, if you decided to go long that day, it was a fake setup, and you probably saw your bucks going away.
Why does this happen?
There are several time frames, starting from the 1-minute to the yearly. Smaller time frames show more noise leading to more fake setups and leaving you with unanswered questions.
How to avoid the mistake?
As the mentor says, “always look at price patterns on the longer time frames.” So this is because the longer the time frame, the more reliable trading signals charts show. So, you can avoid fake setups by looking at the longer timeframes.
Tip 3. Add technical filters
One of the most critical aspects of dodging fake setups is adding technical filters. What technical filtering means is you can’t go berserk on the chart. Instead, you need to add a specialized analysis filter according to your strategy.
For instance, you may have a moving average crossover strategy for the GBP/USD. You’ll go long when a 9-period short-term moving average crosses above the 20-period long-term moving average.
But other traders can’t choose to go long using the same moving average parameters on the stocks or other assets. This is because each asset has a different volatility level and different specifications. What’s good for GBP/USD may not be suitable for other purchases. You may end up entering a fake setup instead of a profitable one.
Why does this happen?
Fake setups pop up on the chart when you don’t perform technical analysis according to your strategy.
How to avoid the mistake?
You can avoid a fake setup by following specific parameters according to your trading strategy.
Tip 4. Forward testing
While backtesting asks you to depend on historical data, forward testing allows you to dry run your analysis. You may be familiar with the term demo trading; this is what forward testing is all about. You test your analyses before implementing them on the live market.
The thing with forwarding testing is it can help you avoid fake setups. For instance, after backtesting, you decided to go long on the EUR/USD. So you enter the trade with a buy position. You are confident that this is the trade that’ll get you your Lamborghini.
But after a few days, you see you’d hit a stop-loss, closing out your position. How the hell did that happen? Most often, traders try to cherry-pick the data when backtesting. They don’t consider all the aspects like entry and exit points. That’s why they make mistakes.
Why does this happen?
As mentioned earlier, fake setups show up when you don’t forward test your analysis correctly.
How to avoid a mistake?
Don’t try to be specific about trades. Instead, pick every aspect of trades and find the system’s logic when forward testing your strategy.
Tip 5. Confirm false breakouts through volume
Usually, traders do not cater to the trading volume while trading, which can be an excellent indicator to filter false actions.
Why does this happen?
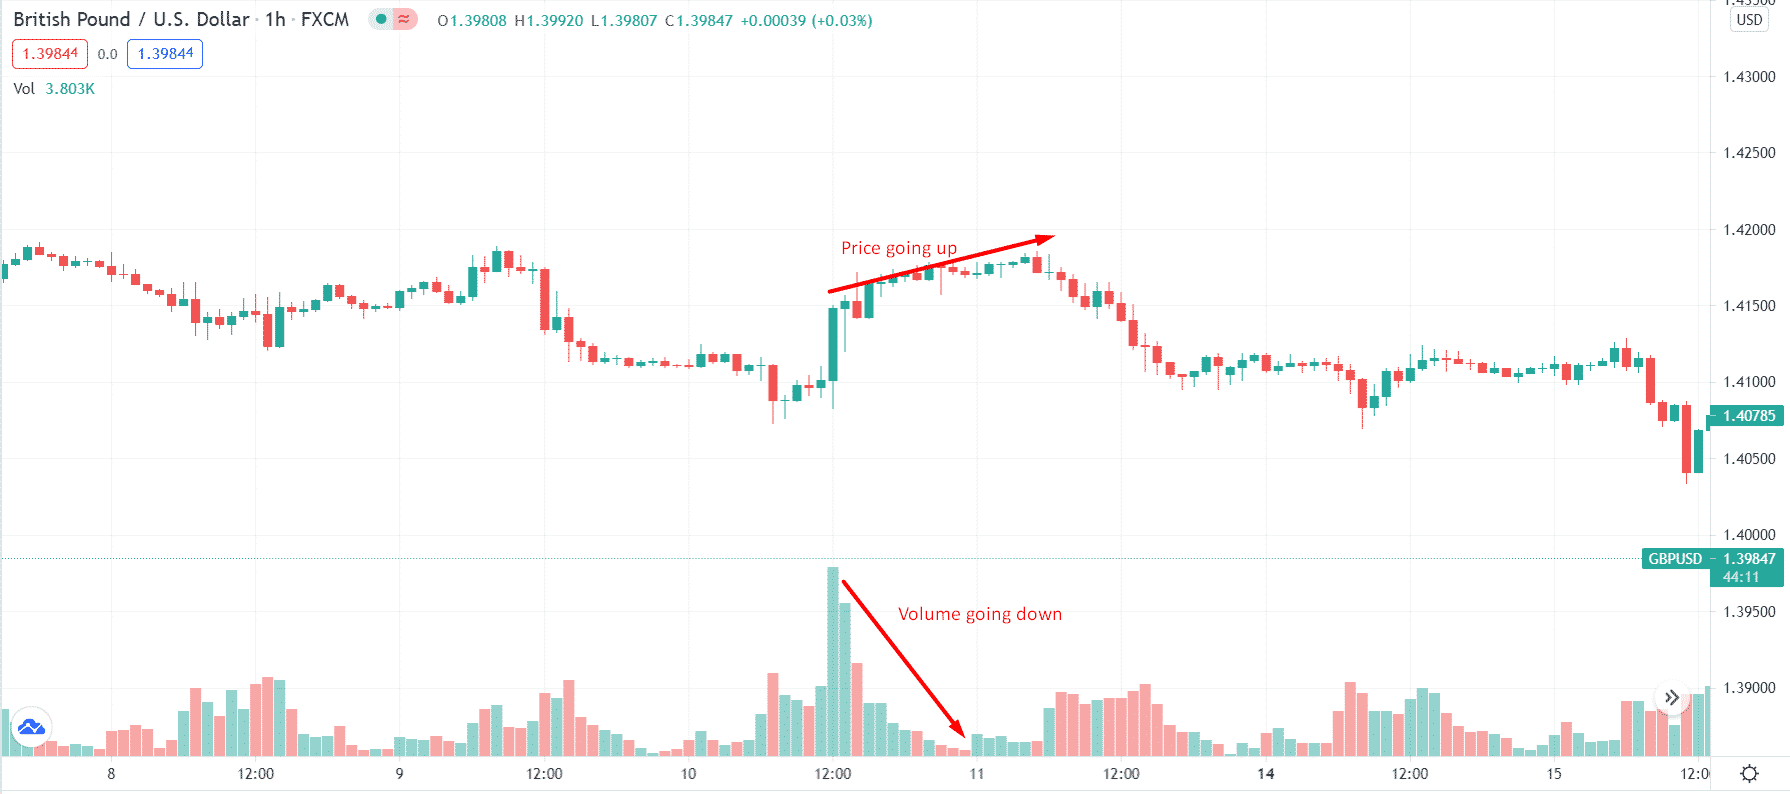
Volume indicator reflects whether the market has initiated a new trend or it is only in corrective mode. Reduced volume during a price wave marks it as a retracement.
How to avoid the mistake?
You can avoid such price traps if you read volumes concerning price moves. Increasing volume indicates a strong trend. For example, look at the chart below.
Final thought
- A fake setup occurs when the price rebounds instead of trending after a breakout.
- When the price closes above the level and begins moving in the opposite direction, this leaves traders trapped on the wrong side of the market.
- A false breakout pattern can provide a profitable opportunity to enter the market when the price retests to the level.
- One way to distinguish between false and true breakouts is to use the volume indicator.
- Breakouts on low or declining volume will most often be incorrect.
- High or increasing volume breakouts will most often be real.
- Use price action and take into account the general market context when making decisions about opening positions.


