Investing in the FX market or any other currency platform can undoubtedly prove challenging. You can predict price movements, however, by learning some chart patterns. Profiting isn’t as difficult as you may think.
Despite many patterns available, it can be challenging to decide which one will be most accurate for predicting where prices will go. So, with the help of a forex cheat sheet, we’ve brought together some of the key continuation and reversal strategies in one place. Learn each one and use it to your advantage.
How can I make money by using cheat sheet patterns in FX trading?
Below you will find seven different patterns you can use as a handout, and you can collectively call them a cheat sheet.
Head and Shoulders
Forex markets have a widespread pattern known as the Head and Shoulders. As their name implies, the diagrams are inspired by human anatomy. For example, a financial instrument, e.g., a currency can reach a high during an uptrend. Then, it falls below the trend line and falls back to the support line, i.e., the neckline. After that, it reaches yet another high before falling below the trend line and finally gets a third high before falling back below the tendency line.
As a result, there are two shoulders on either side of the head. Nevertheless, trades that take advantage of this strategy can offer great trading opportunities for those who understand and trade it correctly.
A mirror image of this one also exists, known as the inverse H&S pattern. First, the financial asset will reach a low or the first shoulder and revert to the bottom line in a downward movement. After that, it reaches a second low or the second shoulder. Finally, it reverts to the trendline while breaking out and closing above the line.
Rising and falling wedges
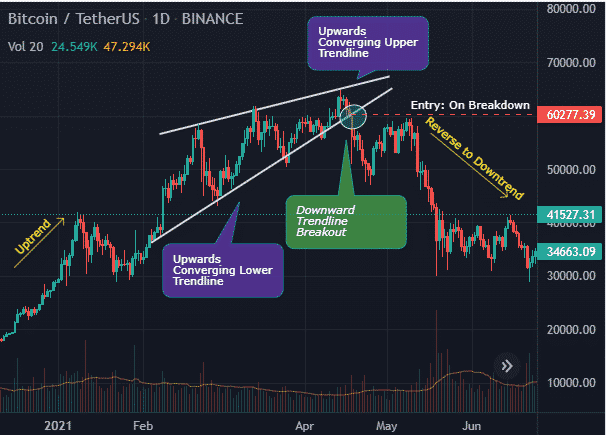
The wedge configuration, also known as the triangle formation, is one of the most common patterns you’ll see on FX charts. This is because price movements in a narrow range become constricted before breaking out at the end of the narrow range, creating these movements.
The rising wedge is a bearish indicator that typically precedes downtrends. It appears when prices consolidate upward. The price drops below the trend line after a series of higher highs and higher lows.
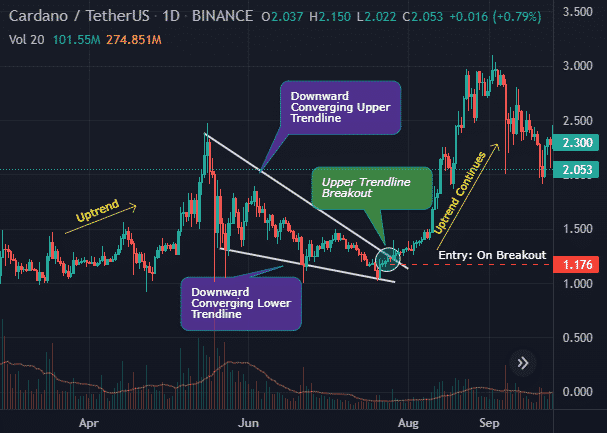
Meanwhile, rising wedges are bullish movements that generally precede upswings. As a result, financial instruments tend to reach lower highs and lower lows as price consolidation trends downward before breaking out above the resistance line.
Double tops and bottoms
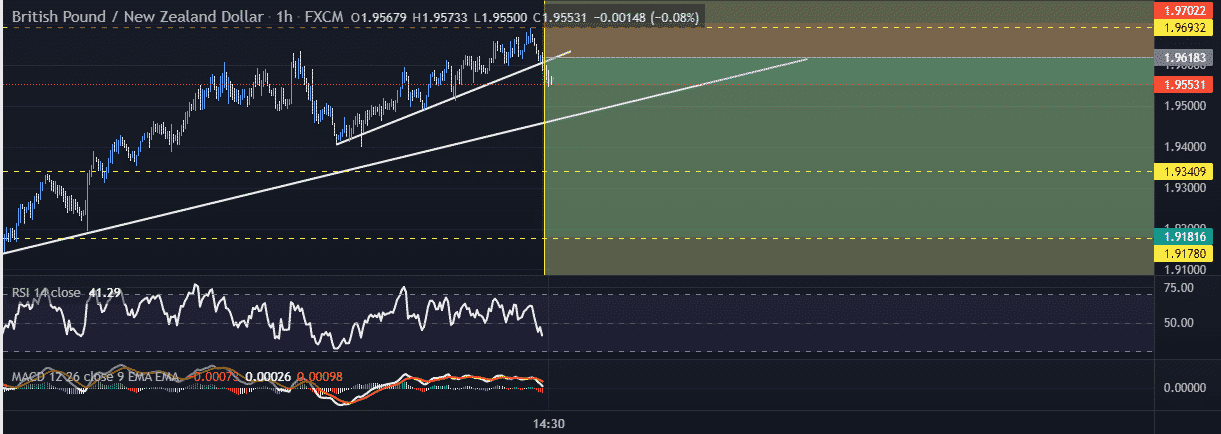
When a currency price moves upward, it may reach the same high on two occasions but may not break through the resistance level. We call this a double top. If the second top isn’t cracked, the price will likely begin trending downward.
On the other hand, double bottoms might indicate an upward direction. When an area of resistance is found at the bottom of a down level, and the price cannot break through it two separate times, this pattern occurs. A price increase is possible after the second bottom is not breached.
Bull and bear flags
Market indecision creates bull flags and bear flags, which are continuation patterns. For example, assume that a currency’s rate rises (the flagpole). Prices may stall or even level off after a period of consolidation (the flag), but for the most part, they remain more or less flat.
The price generally climbs higher and higher after that period ends, continuing its previous trend.
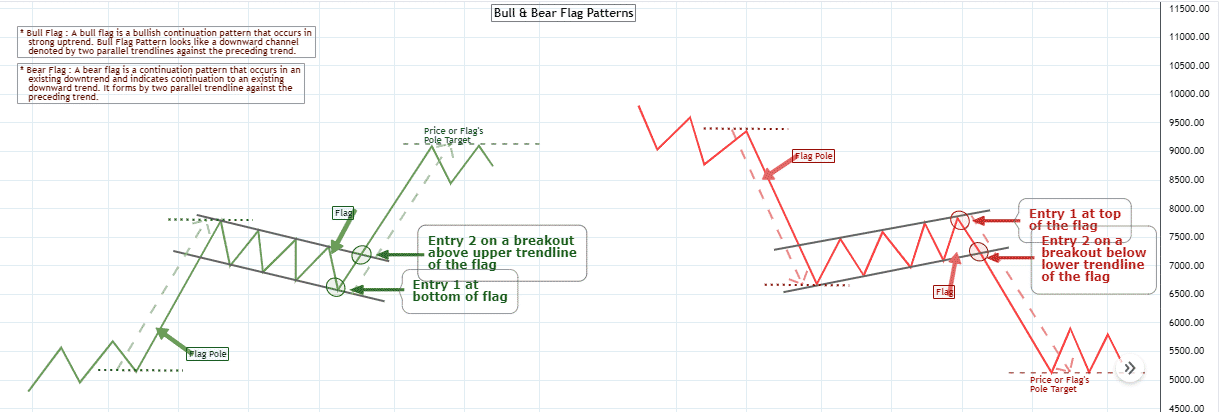
Unlike a bullish flag, a bearish flag signals a downward trend or the flagpole. This is because price tends to stay relatively flat or even trend upwards during a period of consolidation (the flag). Normally, the instrument continues its downward trend after price consolidation.
You can make a large amount of money if you can identify these patterns since you’ll be able to predict with relative confidence when prices are about to spike or drop.
Engulfing strategy
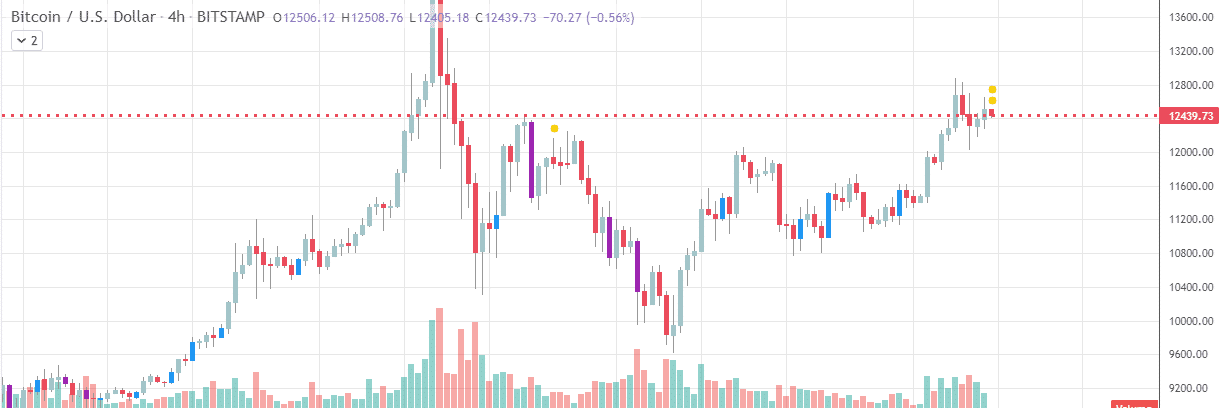
Candles that engulf the previous day’s body are easy to identify due to engulfing patterns. After a downtrend, a bullish engulfing occurs when the body of the previous day’s candle is engulfed by the candle of the following day. The bearish engulfing the previous day’s real body by a down candle after an upper move.
In the event of a bullish or bearish engulfing pattern developing, a breakout in either direction is likely.
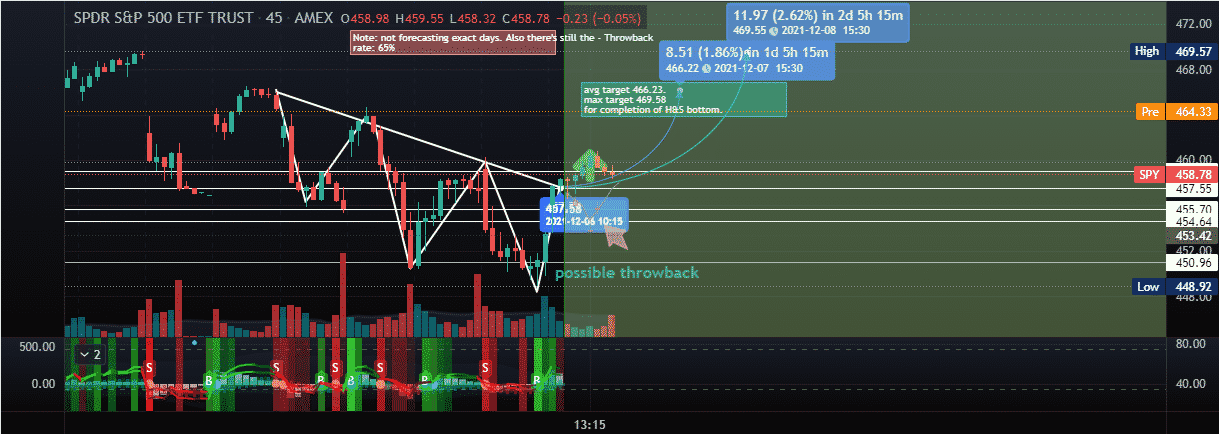
Butterfly charting
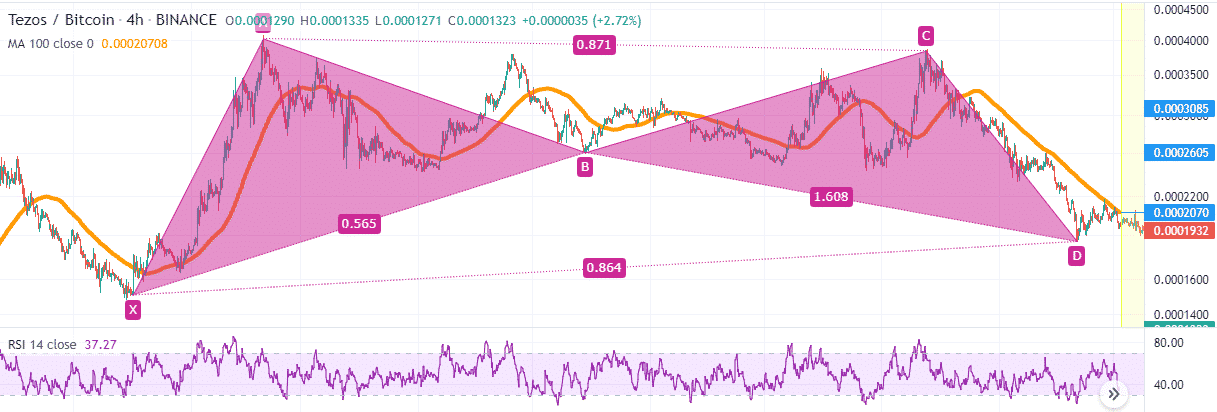
This style features an ABCD type formation which starts with an upper or lower swing originating from X points. It is followed by reversals between points corresponding to Fibonacci extension ratios.
The B points link two triangles or appeared wings that meet in the middle.
In bullish patterns, the butterfly pattern can also appear as a capital “M,” while in bearish patterns, it looks like a capital “W.” If the cost movement continues in this direction, this formation is the sign of trend continuation.
Cup and handle
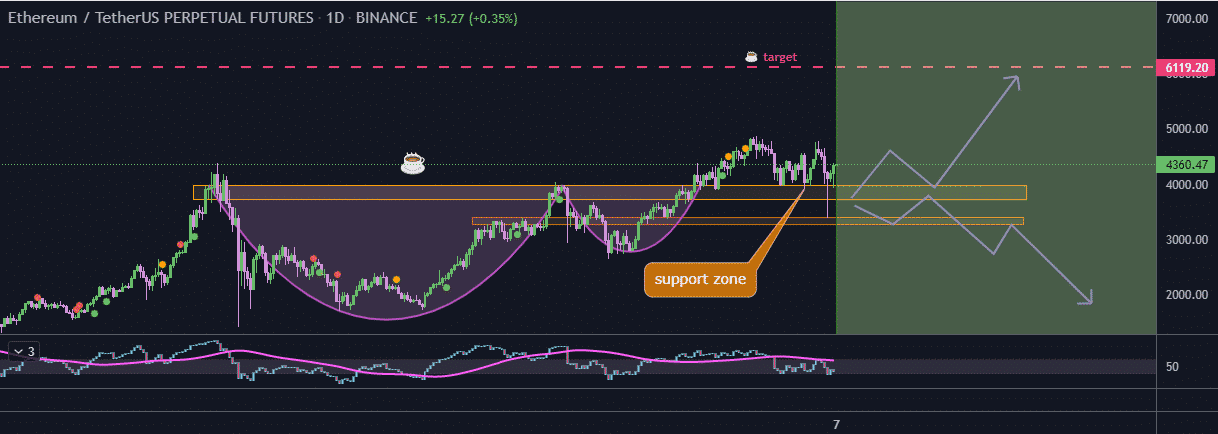
An easy way to identify this pattern is by the cup and handle. The pattern occurs over 1-6 months and gradually returns to the original value. However, the development of the pattern can last anywhere from a few weeks to several years.
Typically, the price drops and rises in smaller amounts to form the “handle” part of the pattern after returning to its original value. This handle normally features a retracement of anywhere from 30% to 50%, with outliers possible.
In particular, when it develops over several months, this pattern is seen as a strong bullish indicator. However, the bullish indicator is less reliable when a trend is developing quickly or over time.
How to manage risks?
Any successful trading strategy relies on having the right mind and managing your risks. The trading conditions are essential when dealing with such volatile news events because they can affect both elements.
To keep a reference guide handy whenever you start trading in a day, a “cheat sheet” is helpful. This cheat sheet can either be printed or be viewed on a different screen so that you can get an idea of profitable deals.
Final thoughts
The more you know about these seven patterns, the more likely you will make good trades. Nevertheless, you shouldn’t stop learning just yet. You can improve your trading decisions by reading about these seven indicators to help you become a more effective trader.


