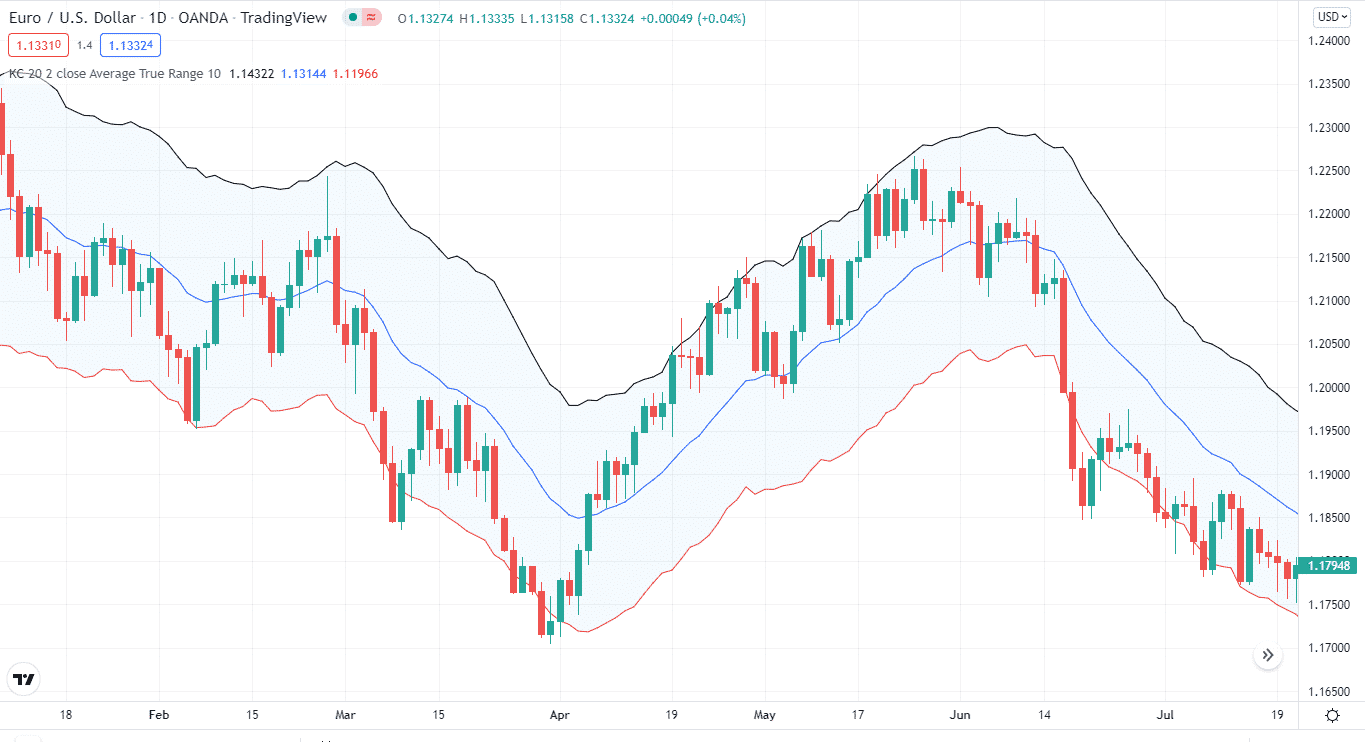
The Keltner Channel is one of the pioneer indicators that tells you about the current trend’s direction. The indicator comprises the upper and lower band and the middle EMA. The bands use the ATR (average true range) to mark the price moves.
In this guide, we’ll dig deeper into the Keltner Channel indicator and how you can use it like a pro.
What is the Keltner Channel indicator?
Chester Keltner devised Keltner Channels in the 1960s, but Linda Bradford Raschke improved the indication in the 1980s. The latter version of the indicator is the one that is now in use.
The present Keltner channel is built by integrating two independent technical indicators. The center band is a 20-period EMA, which is the first component of the Keltner channel. The second component of the Keltner channel is a multiplied value of the ATR, which is typically set to 2.
Because the EMA responds quicker to changing direction price movement, the Keltner channel can offer a correct overall trend direction by filtering the price activity.
Top five tips for trading with Keltner Channel indicator
Now that you know what Keltner Channel is let’s move to how you can trade with the indicator like a pro.
Tip 1. For going long
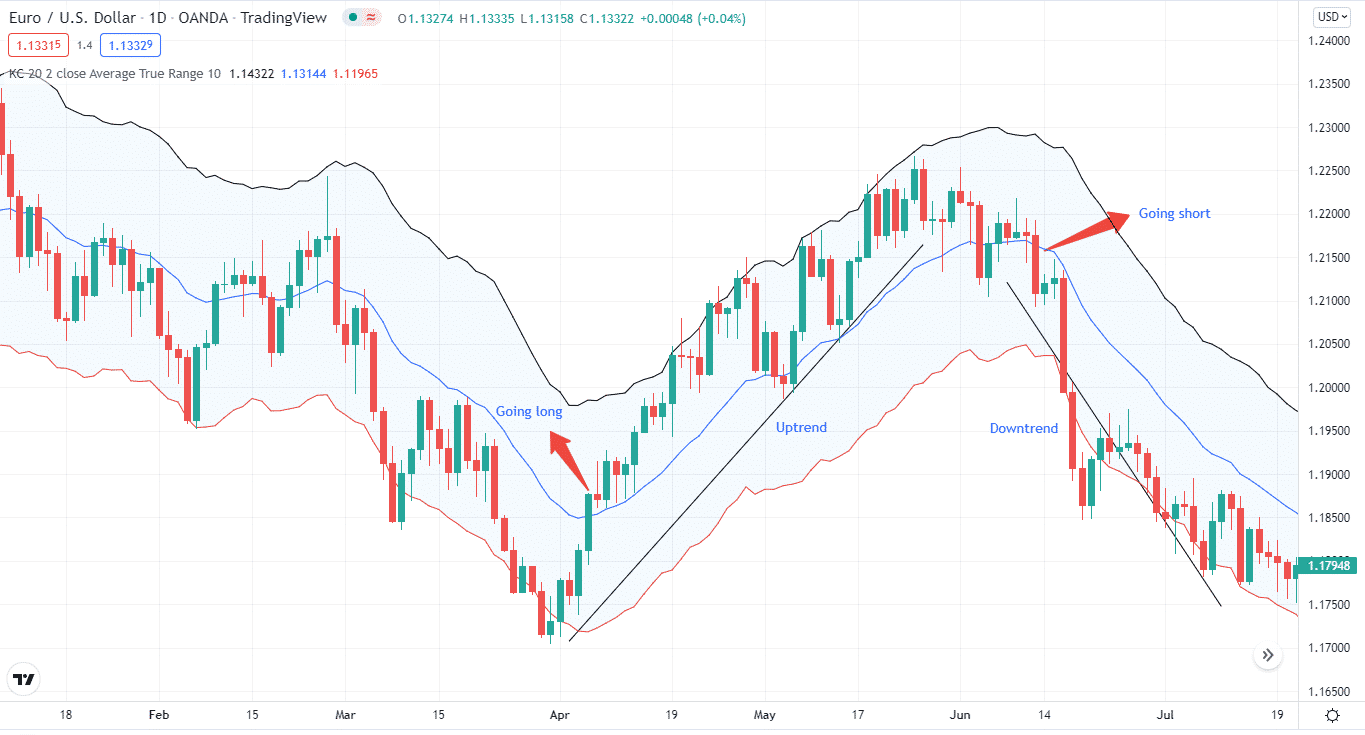
If you want to go long, you need to remember a few things. First, when a forex pair is trending higher, its price should regularly reach or come close to the upper band and sometimes even move past it.
The other thing is the price should also stay above the lower band and will often stay above the middle band or just barely dip below it.
Overall this creates a channel. The rising channel identifies an uptrend, and you can take long positions.
Why does it happen?
Keltner Channel is a volatility-based indicator. It depicts the overall trend with the movement of the three lines. So, when the lines go up, the trend goes upwards too.
How to avoid the mistake?
Markets can become volatile sometimes, so it’s important to know when to go long. On the other hand, if the price goes above the middle line, it presents a solid buying opportunity.
Tip 2. For going short
Like taking buy positions, you need to consider a few things for going short. First, when a forex pair is trending lower, it should regularly reach or come close to the lower band and sometimes even move past it.
The price should also stay below the upper band and will often stay below the middle band or just barely push above it.
Why does it happen?
As mentioned earlier, Keltner Channel is a volatility-based indicator, and the three lines illustrate the trend. So, when the lines make a downward trajectory, the trend goes down also.
How to avoid the mistake?
To limit your chances of wrong entry, you can take positions when the price goes below the middle band.
Tip 3. Trading pullbacks
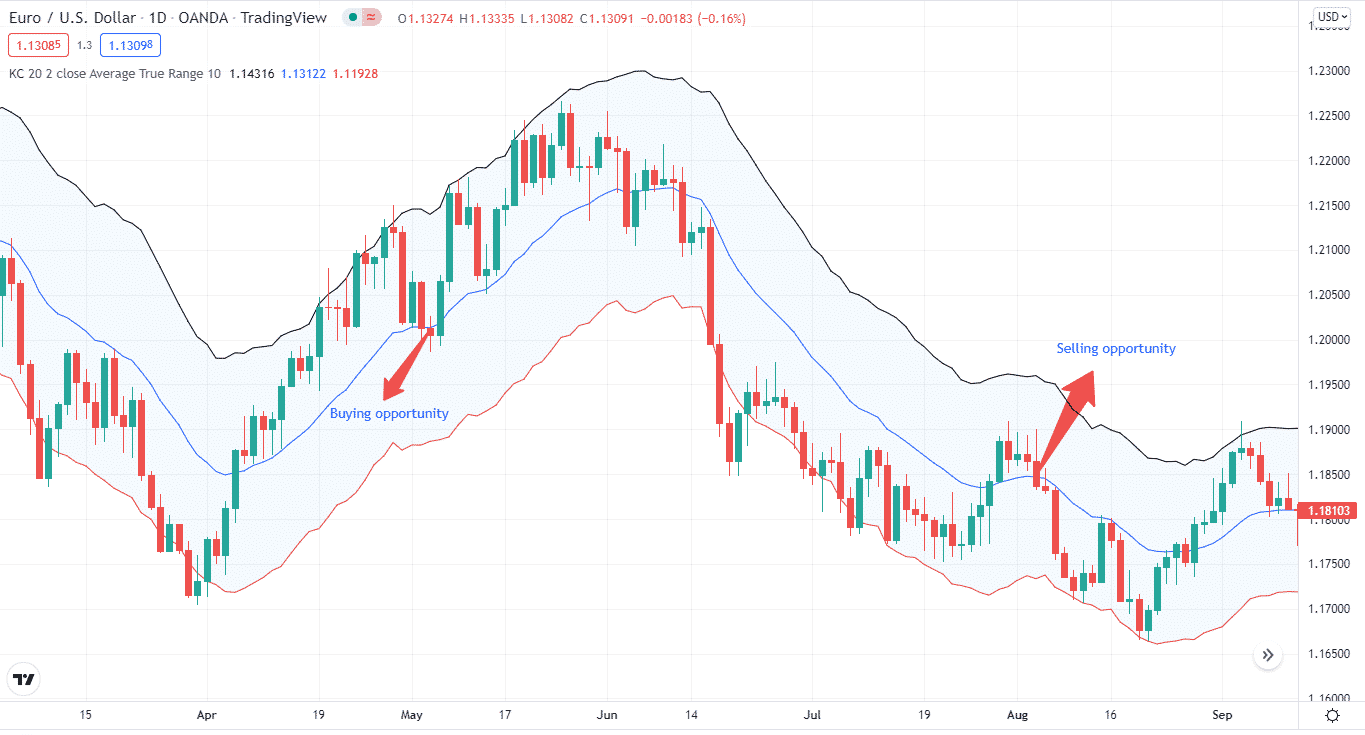
When the price goes up and makes a pullback to the middle line, it offers a good buying opportunity. You can set a stop-loss between the lower and middle lines.
Conversely, the price can make a pullback to the middle line in a downtrend, so it presents us with a good entry point.
Why does it happen?
Price doesn’t go in the same direction. Instead, it creates peaks and troughs several times. So, to trade pullbacks with Keltner Channel, you have to take an entry point at the middle line.
How to avoid the mistake?
Price pullbacks are part and parcel of the market. To not go sideways, you need to enter when the price rises or return to the middle band and then enter positions.
Tip 4. Trading the breakout
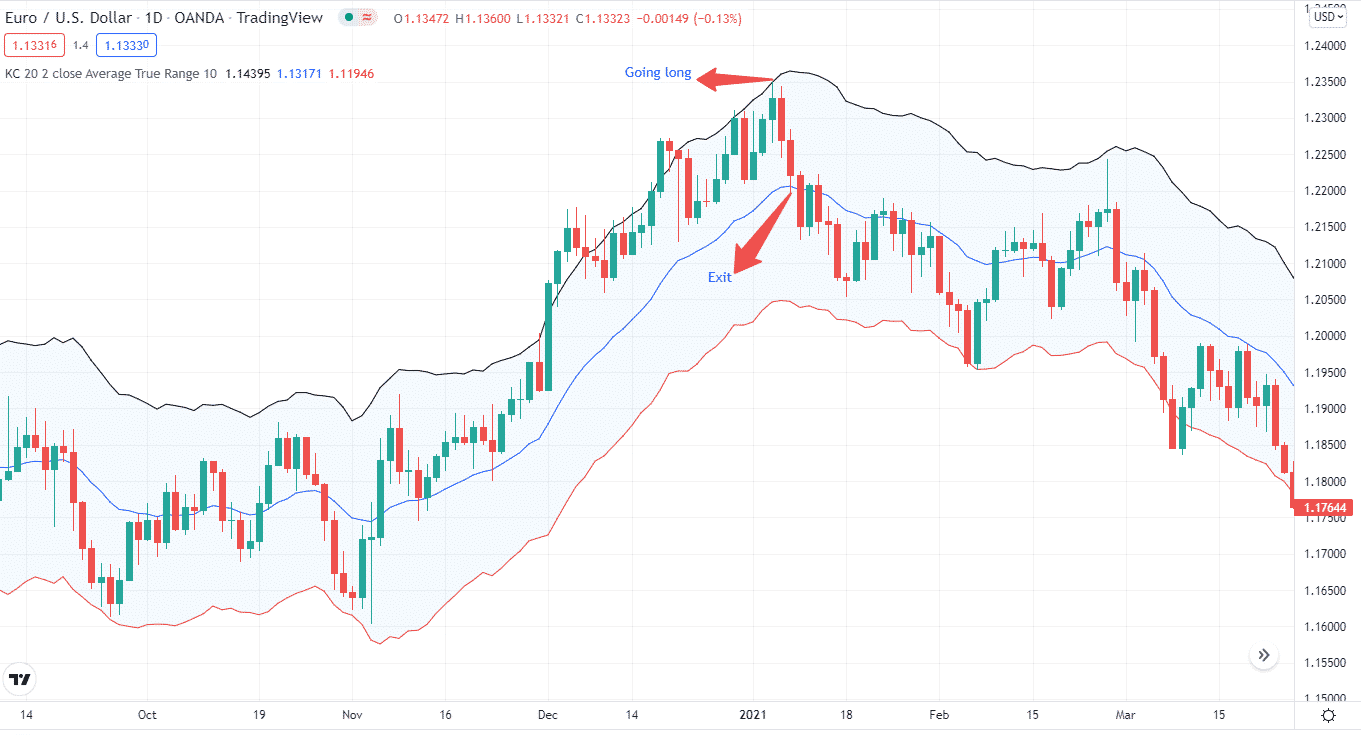
Another strategy you can apply is trading breakouts. If the price climbs above the upper bank, it presents a good buying opportunity. On the contrary, it’s a goof entry point for selling positions if the price goes below the lower band.
You exit the trade when the price reaches the middle band.
Why does it happen?
The upper band is an identifier of a strong uptrend. Similarly, the lower band is a strong predictor of a downtrend. So when the price goes above/below the upper/lower band, it gives us a strong signal.
How to avoid the mistake?
The price can suddenly upward or downward movement and then go sideways. So, you need to locate the price behavior carefully. You can use other indicators also for further confirmation.
Tip 5. Using the RSI with Keltner Channel
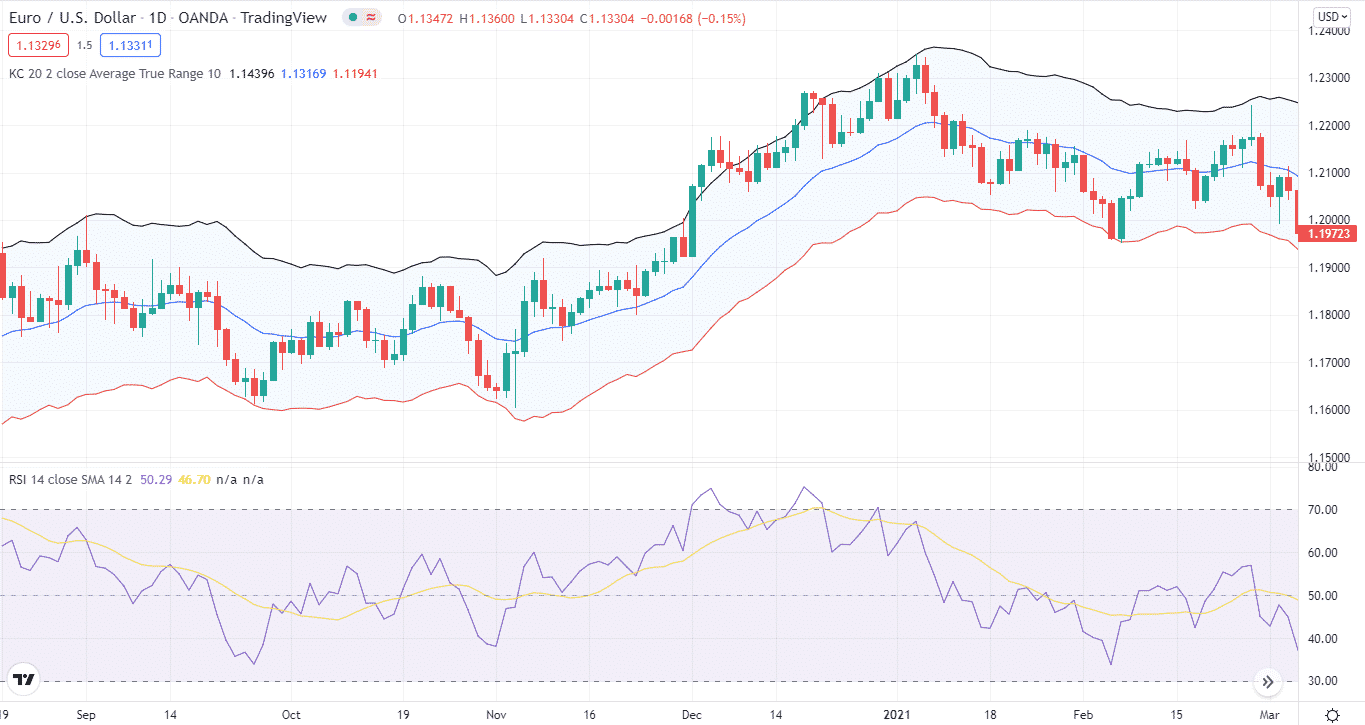
You can also use the RSI with the Keltner Channel. The RSI combined with Keltner reduces some of the false signals.
For instance, when the price touches the lower band and the RSI is below 30, it gives us a good buying signal.
Why does it happen?
One indicator is not better than the other indicator. Therefore, you need to combine the Keltner Channel with RSI or another oscillator to confirm buy/sell signals.
How to avoid the mistake?
Keltner Channel does help in predicting the trend direction, but it can sometimes miss key trading opportunities. So, you need to combine other indicators with the Keltner to detect price moves.
Final thoughts
Keltner Channel is a great indicator for detecting trend continuation and a reversal. The bands give us a clear indication of the price moves. The middle EMA line filters some of the false signals.
To reduce the false signals further, you need to combine the Keltner with the RSI or other oscillator.


