Traders use many technical indicators to check the potentiality of any financial asset. Using such indicators enables market participants to identify more accurate and profitable positions. Moving average is a familiar and prevalent indicator among financial traders and investors.
Several types of moving averages are available to use, such as SMA, EMA, SMMA, WMA, and Hull moving average (HMA). The last one is a more upgraded version that reduces lags that we find in other MA types.
Let’s learn everything you need to know about this useful trading tool.
What is the Hull moving average?
It is a trading indicator that shows more accurate results than SMA as some calculations change. It uses a weighted MA and focuses more current value that helps reduce lags.
Alan Hull created this tool, and its first proposal date was in 2005.

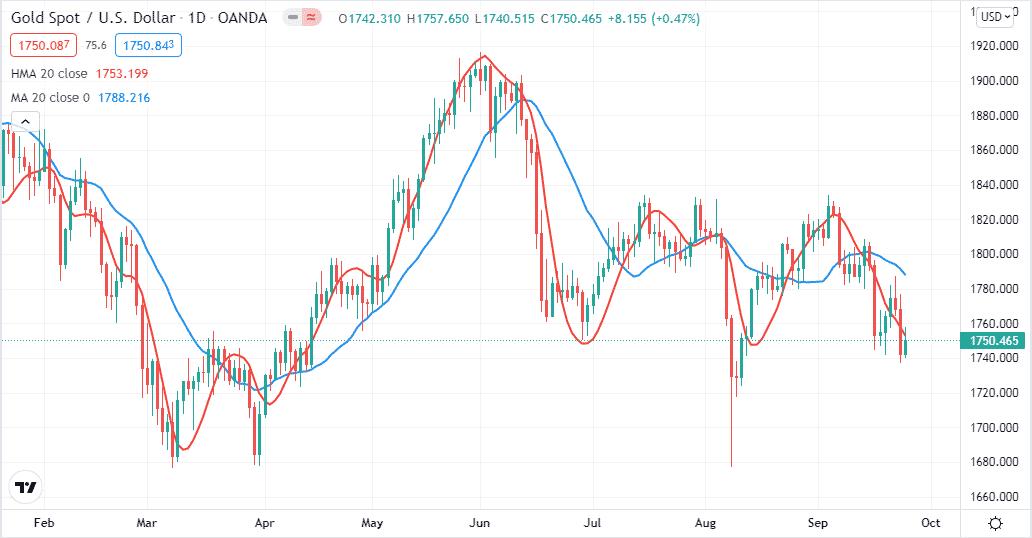
The figure above shows a daily chart of gold. Here, we have applied the SMA — marked on blue and an HMA on red. Both MAs have the same value, 20. There is some lag in the normal MA concept. Hull moving average comes to deal with that age-old dilemma and makes it produce more accurate results.
Hull moving average calculation
The calculation may involve some complexity but applying this HMA in charts will show the most satisfactory results. The HMA uses weighted moving average (WMA) as building blocks.
You can calculate it by following the steps below:
- Select a lookback period such as 100 or 20.
- Calculate the WMA of the price you choose.
- Divide the lookback period of the first step.
- Again calculate the WMA of the closing price using the recent lookback period. If you can not divide lookback periods by two, use the closest number before the comma. For example, if the period is 17, you can use eight or nine as the second value of the lookback period.
- Multiply the second WMA by two, then subtract the value from the first WMA.
- Calculate the square root value of the first lookback. For example, if your first lookback period value is 100, the third value will be ten by square rooting the first value.
- Now calculate the WMA value on the latest result or the third value. However, carefully calculating it on the market price.
The first step calculating formula is:
WMA1 = WMA(n/2) of price
WMA2 = WMA(n) of price
Second, calculate raw HMA by applying the formula:
Raw HMA = (2 * WMA1) – WMA2
Third, smooth the HMA with another WMA by applying the formula:
HMA = WMA(sqrt(n)) of Raw HMA
For example, when calculating the HMA of 13-day, we have two non-hole WMAs. For calculating the n/2 WMA, 13/2 is 6.5, so we can take seven as it is a round figure for calculating the WMA. For the sqrt(n) WMA, the square root of 13 is 3.605, so we can round that to 3 for smoothing calculation on WMA periods.
Benefits of using HMA
Hull moving average is just another type of moving average that involves less lag. However, this indicator is more smooth, fast, and valuable than SMA. It is an easily usable technical indicator that works fine on both longer and shorter time frame charts.
You can use it for any financial asset such as currency pairs, commodities, stocks or bonds, etc. Traders can use the HMA slope to generate trade ideas rather than use it as support & resistance levels.
How to use the indicator in trading?
You can interpret and use HMA as an SMA indicator. It is an easily applicable technical indicator. You can create a complete strategy by depending on this indicator. The advantage is you can use the slope directly as a trading signal.
The concept is simple:
- When the HMA line moves toward the upside, it indicates a bullish price movement.
- When the HMA line goes toward the downside, it means a declining price for the trading asset.
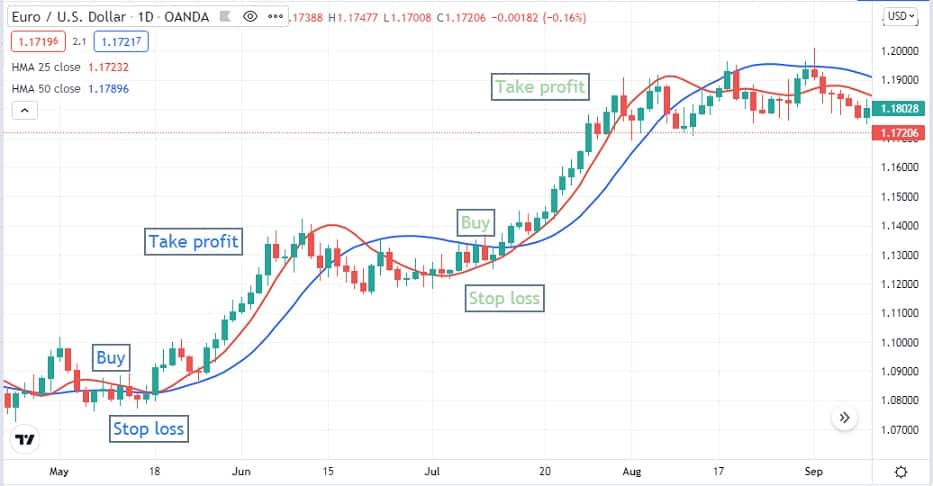
You can trade with HMA of a single value or use HMA crossovers to identify the most potential trading positions. We use two HMA lines in our strategy for more accuracy on trading positions. HMA 25 is the red line, and the HMA 50 is the blue line. This strategy with two HMA lines works fine on any time frame; we suggest using it at a minimum 1-hour chart or above it.
Bullish trade setup
Look at the chart and check if the red HMA line crosses above the blue HMA line. It indicates buyer domination at the asset price. For more confirmation, make sure that both lines are moving toward the upside. Wait till the current candle closes above both HMA lines, then place a buy order.

Initial stop loss will be below the recent low below the signal lines with a 10-15pips buffer. Close the buy position when the red HMA line crosses below the blue HMA line.
Bearish trade setup
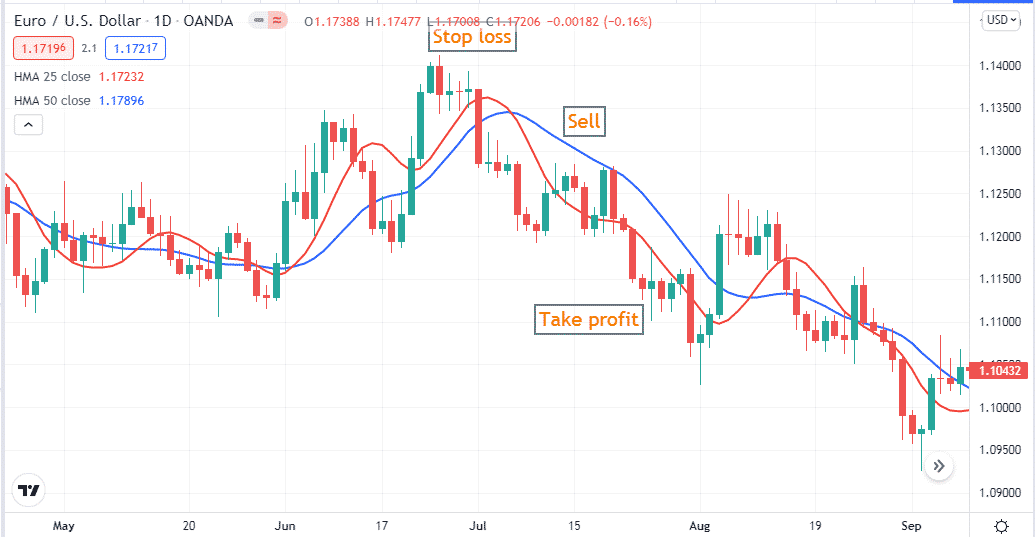
The bearish trade setup is just the opposite of the bullish setup. Check both HMA lines are heading toward the downside, and the red HMA line crosses below the blue HMA line. It indicates sellers may start to dominate the asset price.

Before placing a sell order:
- Wait till the current candle closes below both HMA lines.
- Put an initial stop loss above the recent swing high with a buffer of 10-15pips.
- Close the sell position when an opposite crossover occurs between HMA lines or when the red HMA line crosses above the blue HMA line.
Final thoughts
The Hull moving average indicator involves reducing lag. Short-term traders use the simple turnover of the HMA signal line slope as a trading signal or entry/exit point. Meanwhile, long-term traders can wait till the trend to complete.


