Many technical traders use chart patterns to trade forex. However, nobody seems to be talking about the accuracy of the signals given by these patterns. One commonly used pattern is the inverse head and shoulders. Is it effective?
If we look at the statistics, it seems to be the case. Samuraitradingacademcy.com gives us a figure based on testing ten years of historical data and analyzing more than 200,000 patterns. The inverse pattern has an accuracy of 83.44 percent. This win rate is even higher than those for the double bottom and triple top.
With this win percentage, you will likely succeed as a trader trading only this pattern. You might wonder why there are more losers than winners. Many factors come into the equation. For the most part, the trader is primarily to blame for his failure. If you take all inverse patterns that come your way, you should succeed.
Is the inverse pattern the best forex strategy then? Based on the accuracy, that is likely the case. What is left for you to do is to trade this pattern correctly. You will learn exactly how to do that in this post. After reading this, you will know how to identify, enter, and exit trades using this pattern.
What is the inverse pattern trading strategy?
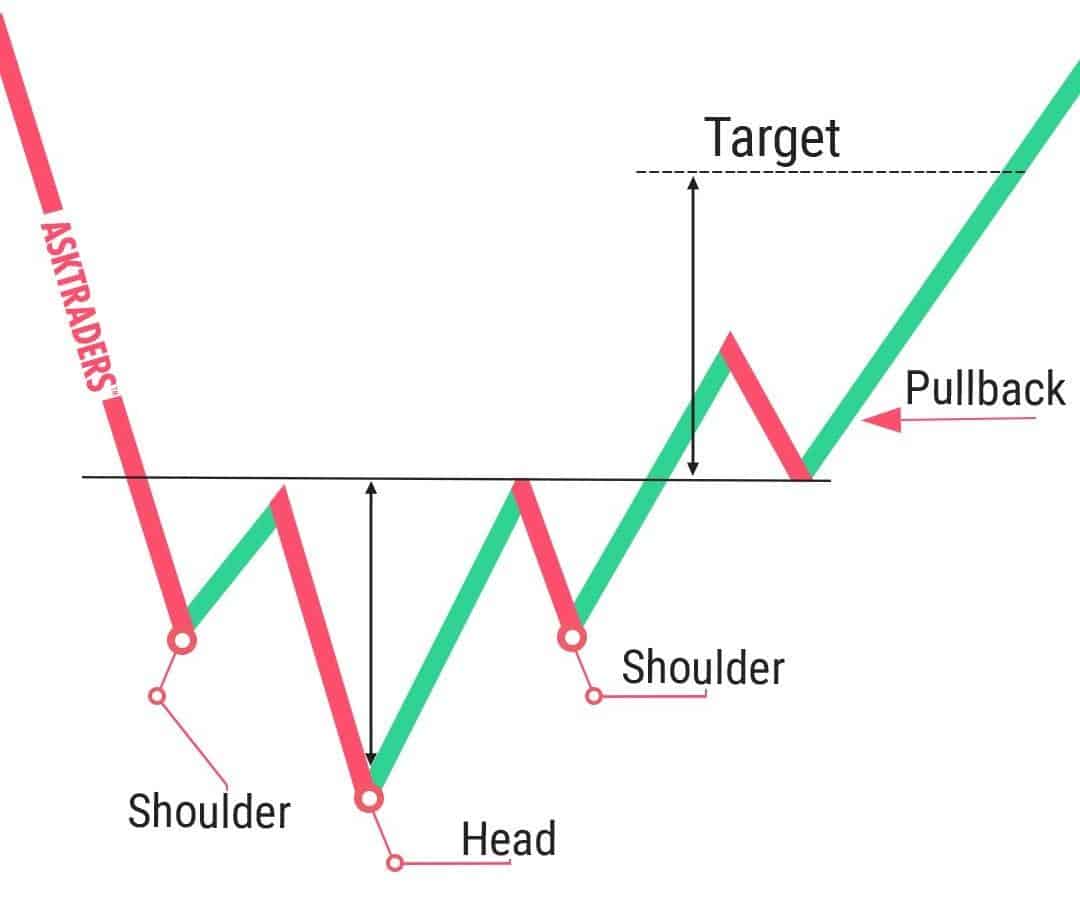
This pattern typically develops after a sell-off and often becomes a precursor of an uptrend. It looks like the diagram in the image below. Based on this, you can tell that the pattern has four components:
- Left shoulder
After this point, buyers come in and can push prices higher.
- Head
The previous rally failed and was short-lived. Sellers step in and regain control, pushing the price down below the left shoulder. However, buyers think the market has reached a bottom and is ready to turn around. As a result, they push prices higher again with more significant momentum and better results than before.
- Right shoulder
Sellers tried one last time to bring the price down, but they failed. They only managed to take the price down to the right shoulder, which is higher than the head.
- Neckline
This level was formed after the two previous rallies. The neckline serves as resistance that price must break to trend higher.

How to trade the inverse H&S pattern?
There are three primary entry points for this pattern: right shoulder completion, neckline break, and backward retest of the neckline. Let us cover each entry in turn.
Since the pattern is evident, excited buyers could get in early by placing buy limit orders on the right shoulder. You could put your stop loss at the point of the head. Since the uptrend is not yet confirmed at this point, you could set your target at the neckline to be safe.
You can use a buy-stop order to enter early. Breakout traders might enter at the break of the neckline. You can also wait for a candle to break and close above the neckline. After the candle closes, place your stop loss at the right shoulder and “take profit” at the default target.
For conservative traders, you can play safe by waiting for the price to break out and then come back to retest the neckline. Here you can place a buy limit order at the neckline. If you are a candlestick trader, you can wait for some candlestick confirmation after the price touches the neckline. Setting the stop loss here could be difficult because the target is close to the entry.
Bullish trade setup
Since this pattern gives a buy entry signal, we cannot provide a sample sell trade here. Instead, we will take a look at two buy-trade setups.

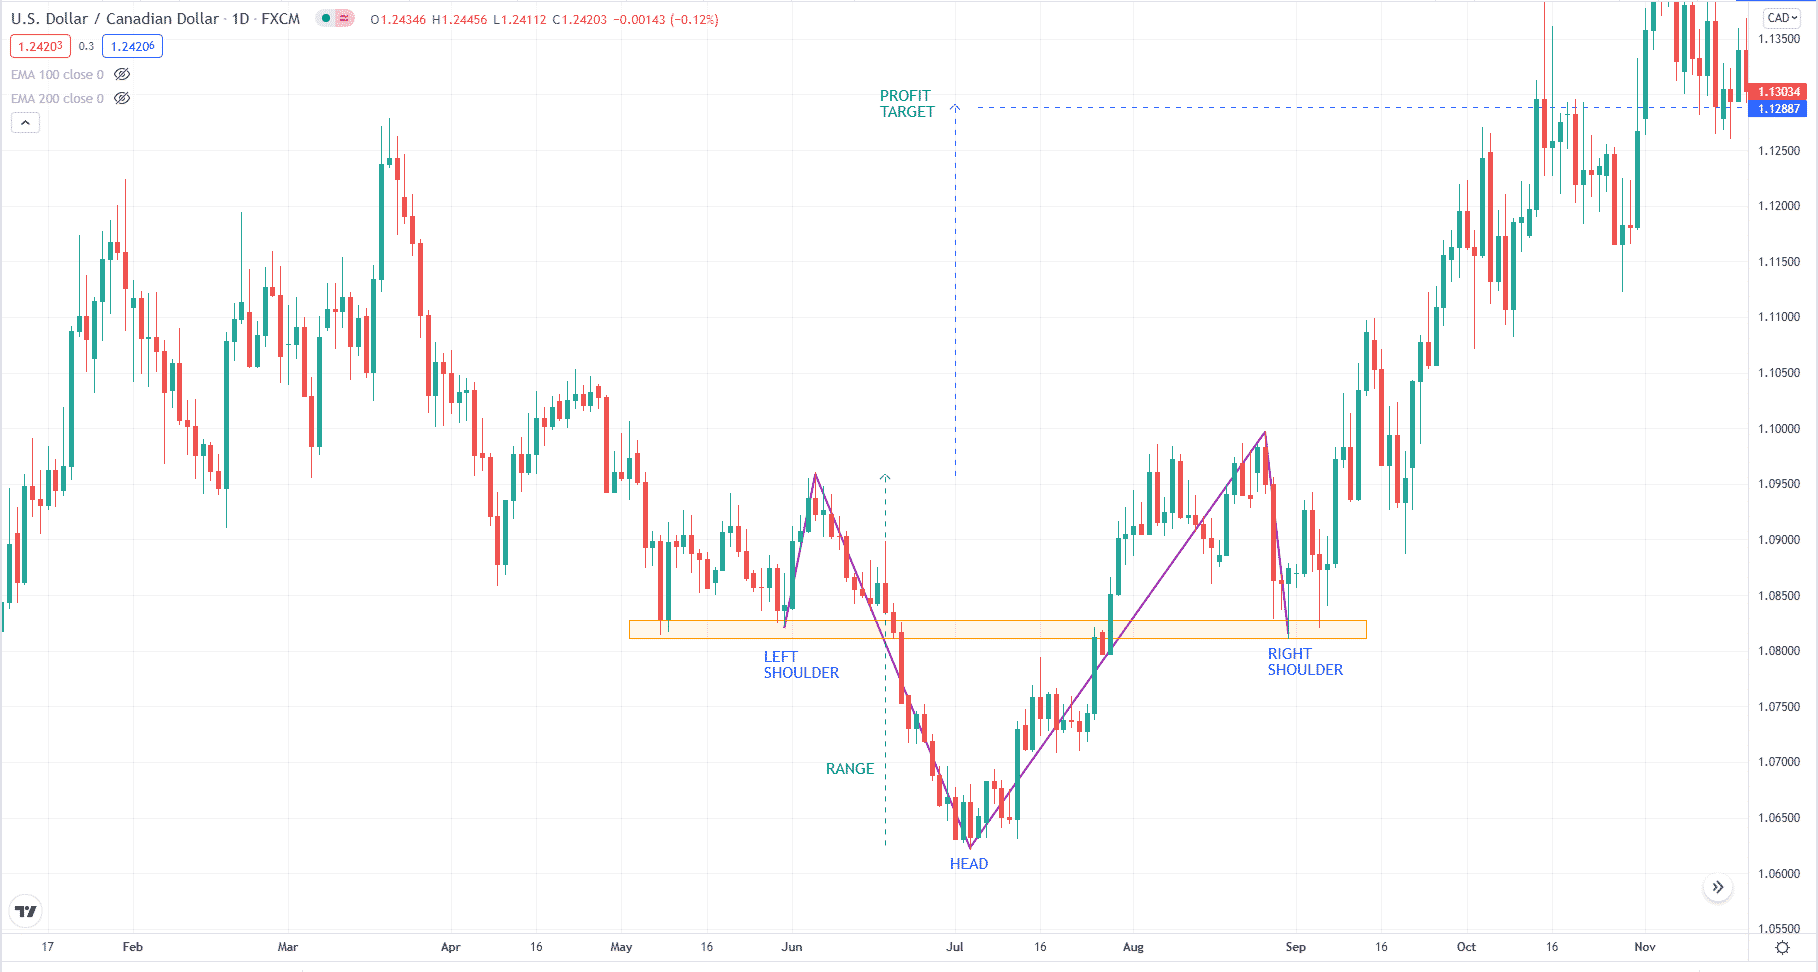
The first example is a buy setup that occurs on the USD/CAD daily chart. On the chart above, the head went far underneath the shoulders. However, the structure is pronounced and valid. The shoulders are flat, but the neckline is slightly inclined upward.
The best entry here is the bullish candle on the right shoulder. If you miss that entry, you have another chance as the price returns to the right shoulder, forming a bullish pin bar in the process. With this entry, you can use the low of the bullish candle as the stop loss location and utilize the standard take profit target.

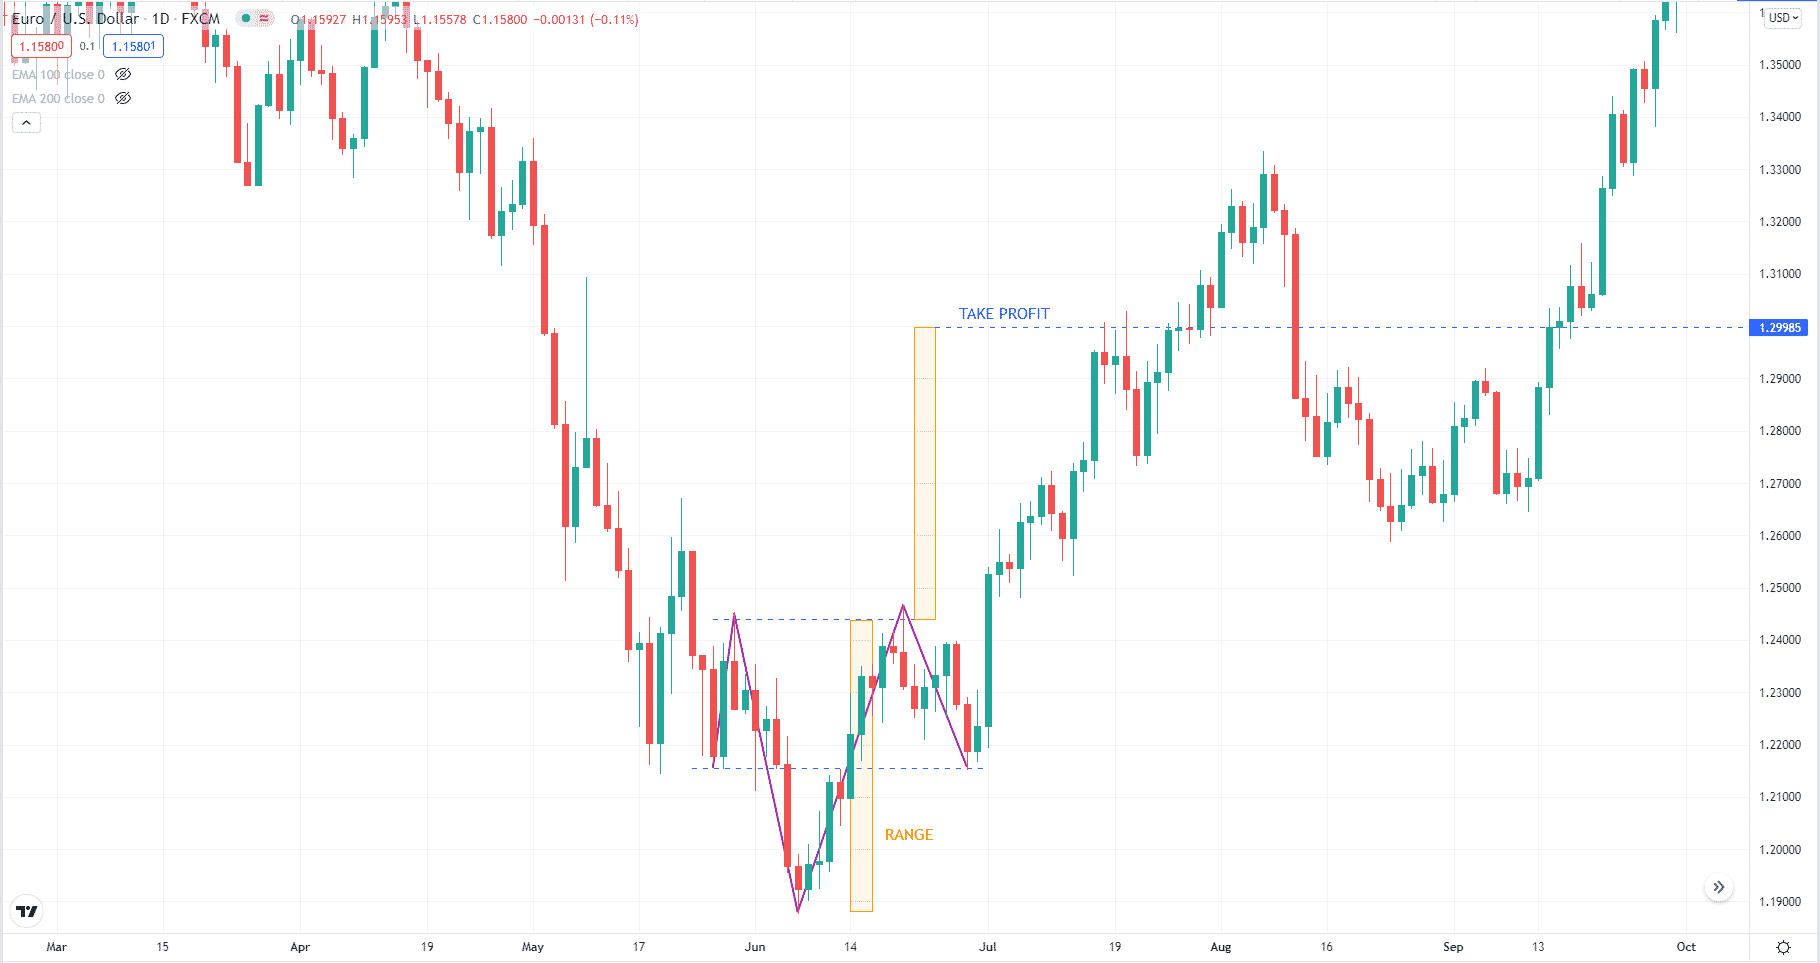
The second buy setup happens on the EUR/USD daily chart. Unlike the previous example, this setup was completed relatively quickly. It took very few candles to complete the pattern. Still, the structure is evident. The shoulders are reasonably flat, so is the neckline. The entry here is challenging, but you can use the inside bar pattern that forms at the right shoulder. Then you can set the stop loss underneath the right shoulder and aim for the desired take profit target.
How to manage risks?
FX trading, regardless of the strategy being used, involves the risk of losing your capital. To avoid this, you must use a stop loss. With it, you can define the risk in every trade even before you execute the trade. Your risk is the distance from your entry price to the stop-loss price. To maintain the same risk amount in every trade, you must use a risk percentage. Typically, professional traders suggest not more than two percent risk.
Final thoughts
The success ratio of this pattern is ridiculously high. It is indeed one of a kind. You can rarely find a strategy with this high win rate. To use the odds in your favor, you should trade every inverse pattern you see. Even if you aim for a 1:1 risk-reward ratio, the high success ratio will see you through. If you do this consistently over a hundred trades, you will see the real success ratio of this pattern. Before you trade with real money, be sure to test the strategy on a demo account. Once you become comfortable with your trading skill, you can move on to a real account.


