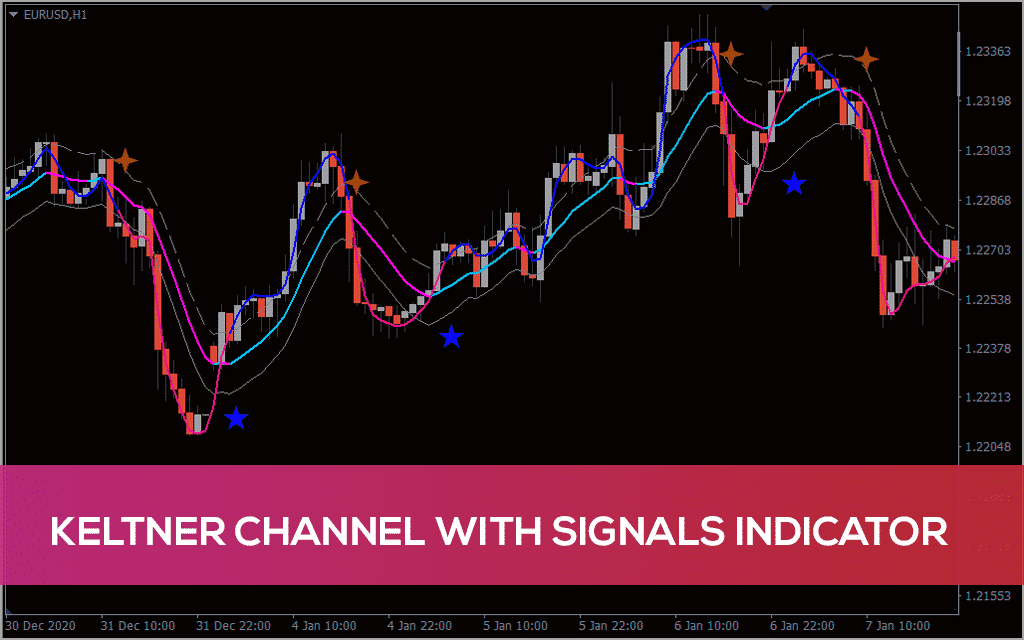
Day traders can quickly investigate the ongoing trend and often provide the major trading signals through the Keltner Channels (KC). Therefore, this famous trading indicator is utilized in trading systems by day traders.
These trading channels use volatility and average prices to plot lower or upper and middle lines. Hence, all three lines move with the price by producing a series of appearances like this KC.
In short, the KC acts as volatility-based bands positioned into one side of the asset’s price. As a result, you will find them helpful in determining the direction of the trend.
What is the Keltner Channel trading strategy?
Traders use the technical trading analysis of the KC system indicators within specific financial markets. This indicator also displays the advanced graph to highlight pricing movements within those three lines.
This channel helps predict trends inside trading markets or generate signals for successful trading. Traders use technical indicators to mitigate risk and capital loss during volatile market conditions.
Since it is so effective and easy to use, it is employed over various financial instruments, such as commodities.
Our next-generation platform will enable you to trade forex, stocks, and cryptocurrencies or indices as well.
The formula for calculating the Keltner Channel
KC can be calculated through an ordinary formula. In this formula, EMA is of 20 periods, and ATR is of a maximum of 10-15 periods. The required formula is:
- Middle line = exponential moving average (EMA)
- Upper channel band = EMA + (2xATR)
- Lower channel band = EMA – (2xATR)
It is quite a lot easy to fully adjust the calculations of this channel based on the trading asset you are about to trade. Thus, it probably varies from any clean 2.0 multiplier. If the multiplier is higher, then this channel comes out to be wider.
How to trade with Keltner Channel?

This indicator is generally helpful for measuring price trends. In this way, the price of any highly trending asset will surpass the ratio of the upper band.
If a trader does not follow the required guidelines, the calculations will display wrong results. As a solution, a trader has to lower or increase the multiplier, after which the price might fall within the certain width of this Keltner channel.
Keltner channels and Bollinger Bands (BB) are popular indicators in the advanced technical trading analysis. They help to identify powerful opportunities for trading in both bearish and bullish markets.
BB helps display market trends. It even lets you know if the instrument’s price is low or high on a relative basis. BB generally displays three lines on top of price charts for MA’s middle line. But Keltner Channels uses the ATR indicator to set up lower and upper bands.
Bearish trading setup
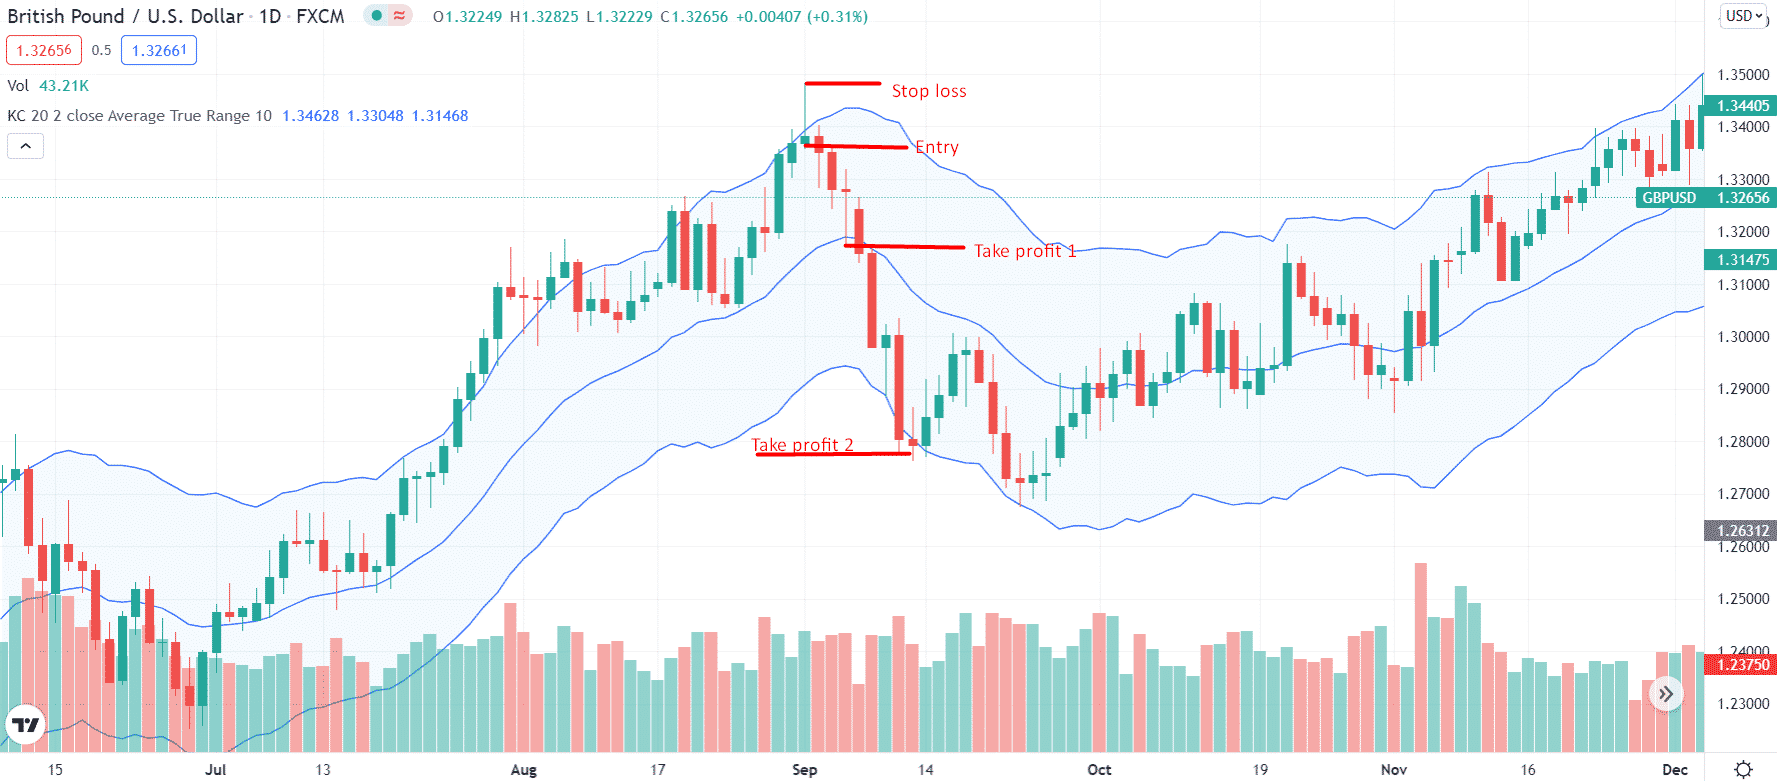
Let’s get started with a practical trading example. With this tool, you will learn how to enter and exit the trading position.

Entry
If you closely look at the figure above, you will find an entry point marked when the price failed to push beyond the upper band of the Keltner Channel. Wait for the candle to close. You may enter instantly or place a sell stop order a few pips below the low of the rejection candle.
Stop-loss
Choose a swing high or rejection zone as your protection area for a stop-loss order. This is where the price failed to break. Hence, we expect the price to respect that high.
Take profit
If you are a conservative trade, you may choose to close your trade in profit when the price reaches the centerline. However, the optimal point to exit is at the lower band for longer holding traders.
Bearish trading setup
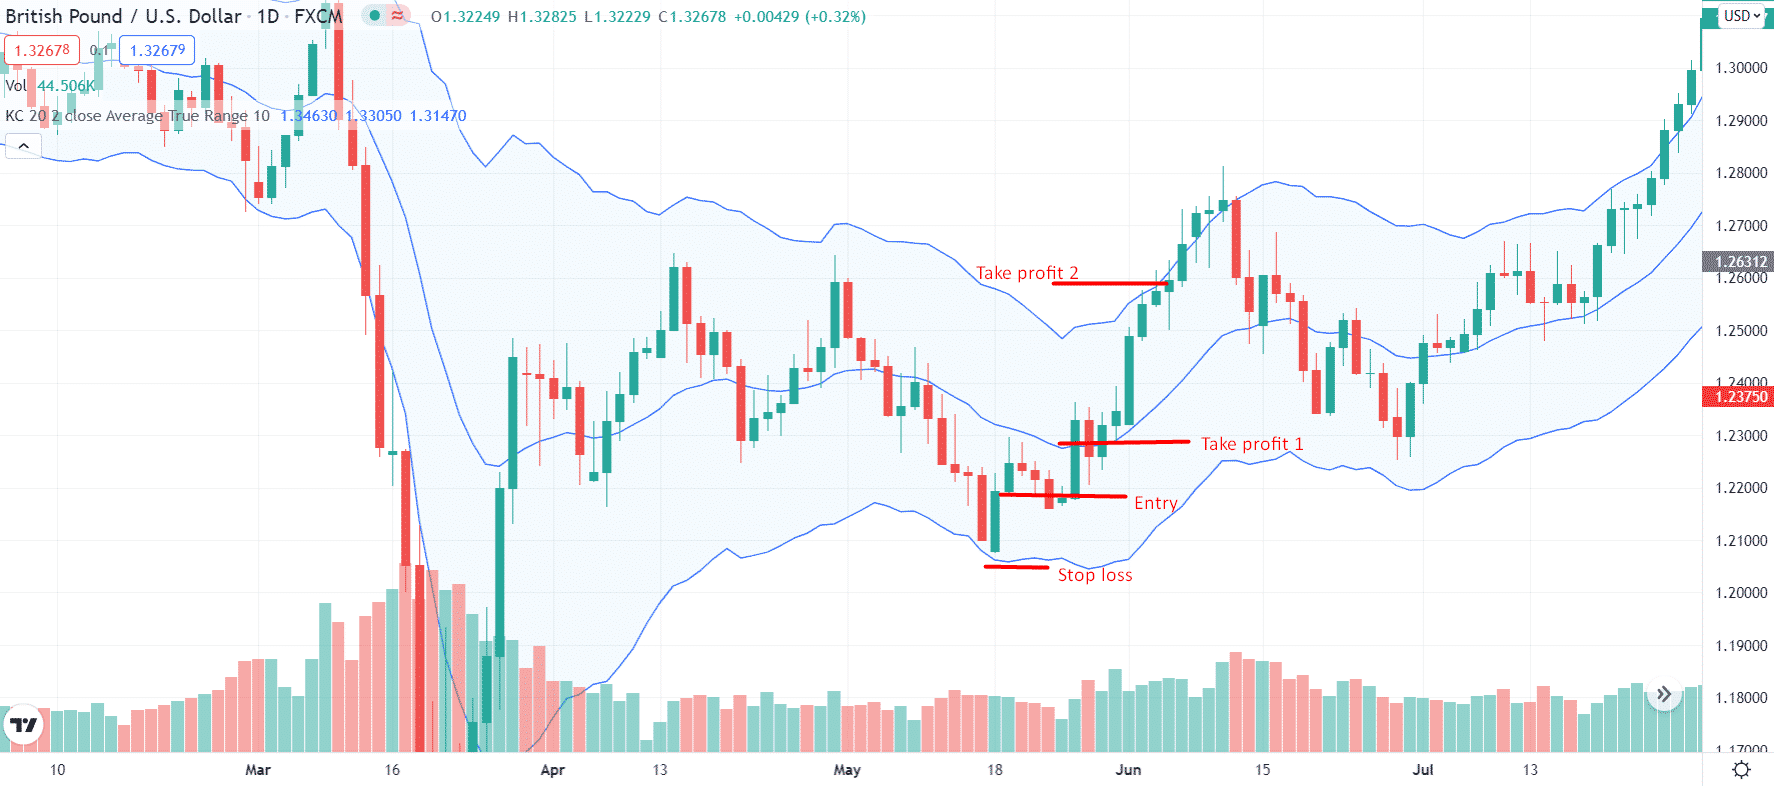
Since you understand the bearish setup, it’s even easier to grasp the bullish setup as it is just the inverse of the bearish setup. Take a look at the below chart.

Entry
When the price hits the lower band, you can enter a position, fail to pierce it, and start moving up. Wait until the rejection candle closes and then enter.
Stop-loss
Look at the rejection zone below the lower band. This is your area to place the SL.
Take profit
You might wait until the price touches the upper band if you got the patience. So you take profit is at the upper band. However, you may partially or fully close the position near the centerline if you like.
How to manage risks?
Undoubtedly, day trading has become the center of attraction of various traders due to the high popularity of numerous trading apps. This includes Acorns, Robinhood, Fidelity, and so many more.
But if you are planning to trade with the Keltner Channels, you need to follow a few essential tips to manage risks. Those essential tips are:
- Utilizing these KCs as in day trading, there is a need to set the basic intervals, which need to be measured based on shorter periods of around 20 days.
- Breakout trading strategy is applicable in day trading, but you need to avoid it during the second half of the trading day.
- Oversold/overbought markets turn out to be low-yield. But it acts as the low-risk strategy taking away the day trades.
- Like the rest of the day trading techniques, setting a proper SL for the trade is essential, which is conservative.
Final thoughts
To end with this whole discussion, if you are trading various instruments, it is essential hence to adjust the trade settings of the Keltner Channel system slightly. It might be possible that the working of settings on one trading asset is not suitable for the other instrument. The difference comes your way.
It is necessary to practice it through a demo account before utilizing these channels to trade with the real money eventually.
It would help if you completely understood how to trade on these signals successfully. Plus, it is essential to know which trade to avoid and which one to place.


