You can trade the currency market in many ways. Either you use someone else’s strategy, or you develop your own. It is not too difficult to come up with your strategy anyway. Just open some charts and apply one or two indicators of your choice. You might find a market phenomenon that occurs very often that you can take advantage of. That is how to build a trading strategy from scratch.
We are not going to create a new trading strategy in this article. What we will do is learn a unique trading strategy that is not popular with many. This strategy approaches technical analysis in a different but exciting way. You might get one tip or two that you can add to your trading toolbox, or you might use this strategy in its entirety in your trading.
Let us understand first what the ICWR trading strategy is.
What is the ICWR strategy?
The term ICWR stands for “impulsive/corrective wave retracement.” This strategy analyzes each swing to determine the trend direction, which might be elusive if you look at one time frame only. Compared to other trading methods, the ICWR strategy does not use moving averages, trend lines, or channels to understand the general market direction.
This strategy is based on the concept that a trend consists of impulse and corrective waves. For example, a bullish trend consists of an upward impulse swing followed by a downward corrective swing that will stop before the initial impulse swing. Finally, another upward impulse swing that breaks the high of the initial impulse swing ensues and confirms the existence of an uptrend.
ICWR strategy overview
The ICWR method is an intraday trading strategy. It attempts to find a trade opportunity on the five-minute chart that is supported by the trend on the daily chart.
Here is the overview of the ICWR trading strategy:
- Use a candlestick chart to analyze the price movement.
- Look for an ICWR breakout on the five-minute chart. This is the primary entry signal.
- Check if the entry signal aligns with the 14-period relative strength index (RSI) momentum on the daily chart.
- Use a stop loss of 50 pips to exit a losing trade.
- Close the trade when the trend has changed on the five-minute chart based on the ICWR breakout concept.
You might find the points mentioned above confusing at this point. Do not worry. You will understand everything when we get to the next section.
ICWR strategy entry rules
This section covers the process of implementing the ICWR strategy. It outlines the steps you should take when looking for trade entries using this strategy.
Recognize the active wave
Follow the steps below when determining the active wave:
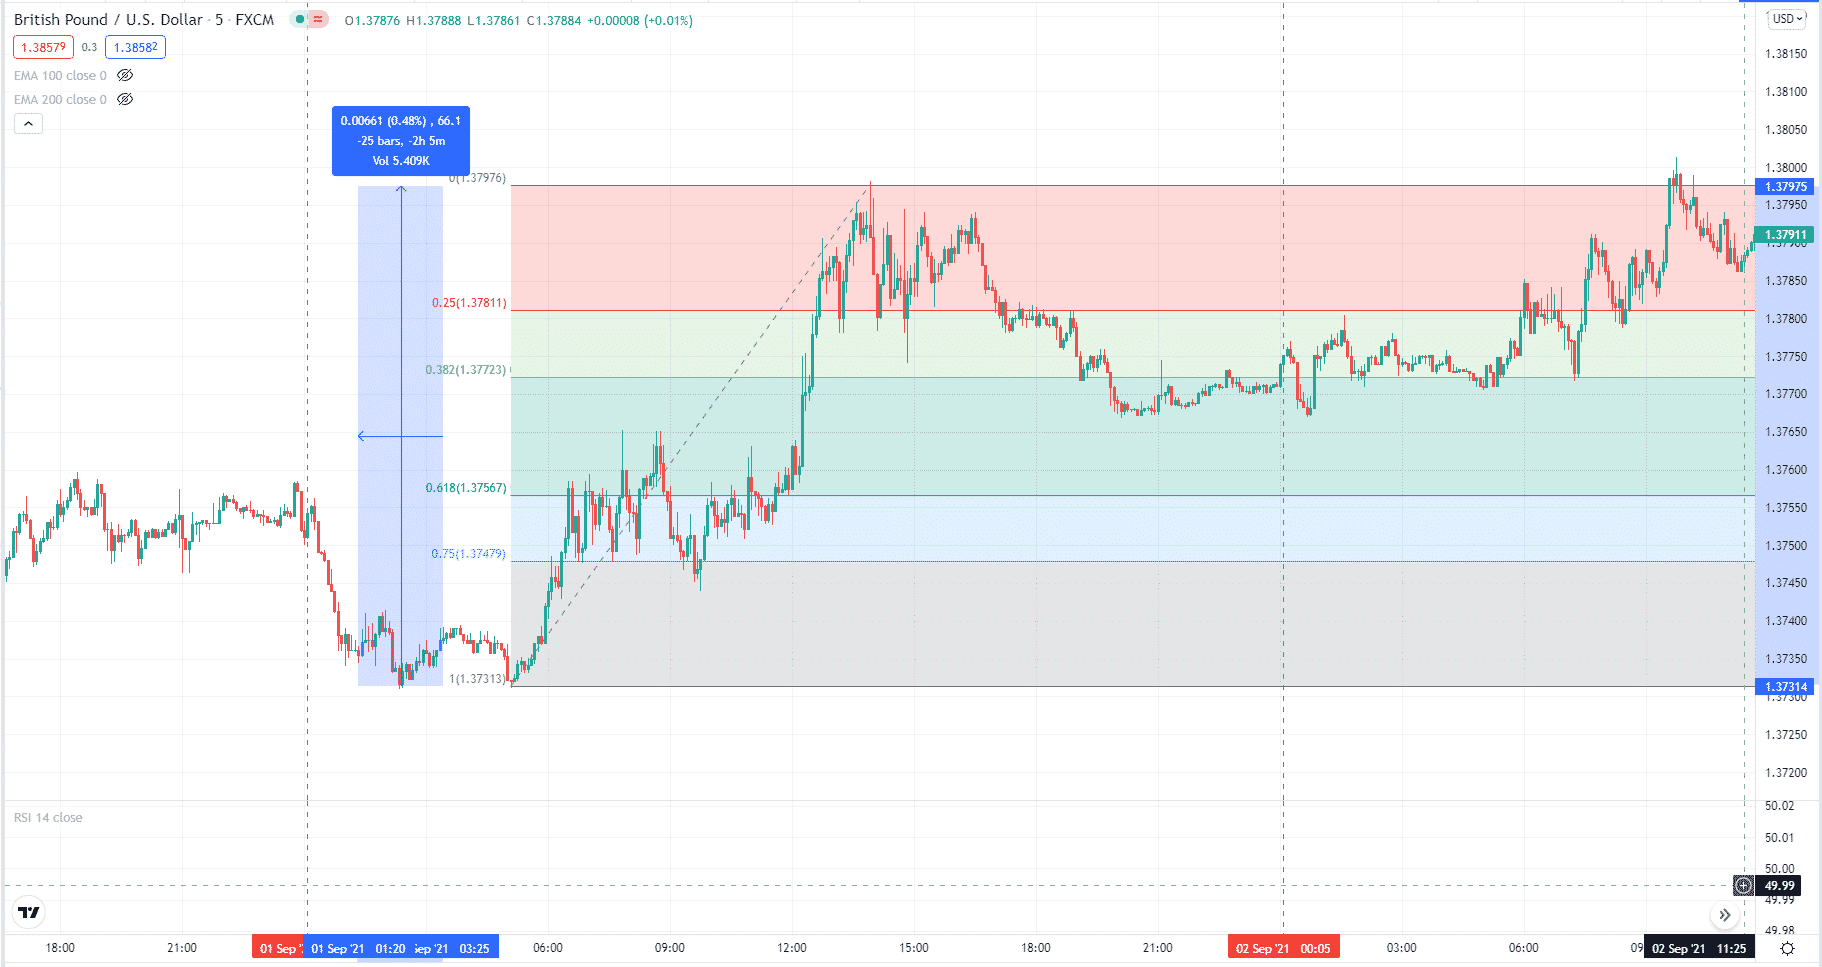
- Determine the price swings with at least 40 pips in length. The swings could be going up or going down.
- Use a trend line to connect the high and low of the price swings, which is unnecessary but helpful if you are starting with this strategy.
- Identify the price swing that is closest to the current open candle on the five-minute chart. So this is the active wave.
If none of the waves has a height greater than 40 pips, you have to go further in the past until you find the active wave. As time goes on, a new price swing with a height greater than 40 pips will occur. When that happens, the previous active wave will become inactive, and we will have a new active wave.

Consider the above GBP/USD M5 chart. Here we analyze the price action for 01 September 2021. As you can see, we have identified an upswing with more than 40 pips. This will be our active wave, assuming this is the wave closest to the current price.
Draw the Fibonacci levels
Every time you recognize a new active wave, apply the Fibonacci retracement tool on that wave. For this strategy, we want to show only the following levels:
- 0%
- 25%
- 38.2%
- 61.8%
- 75%
- 100%
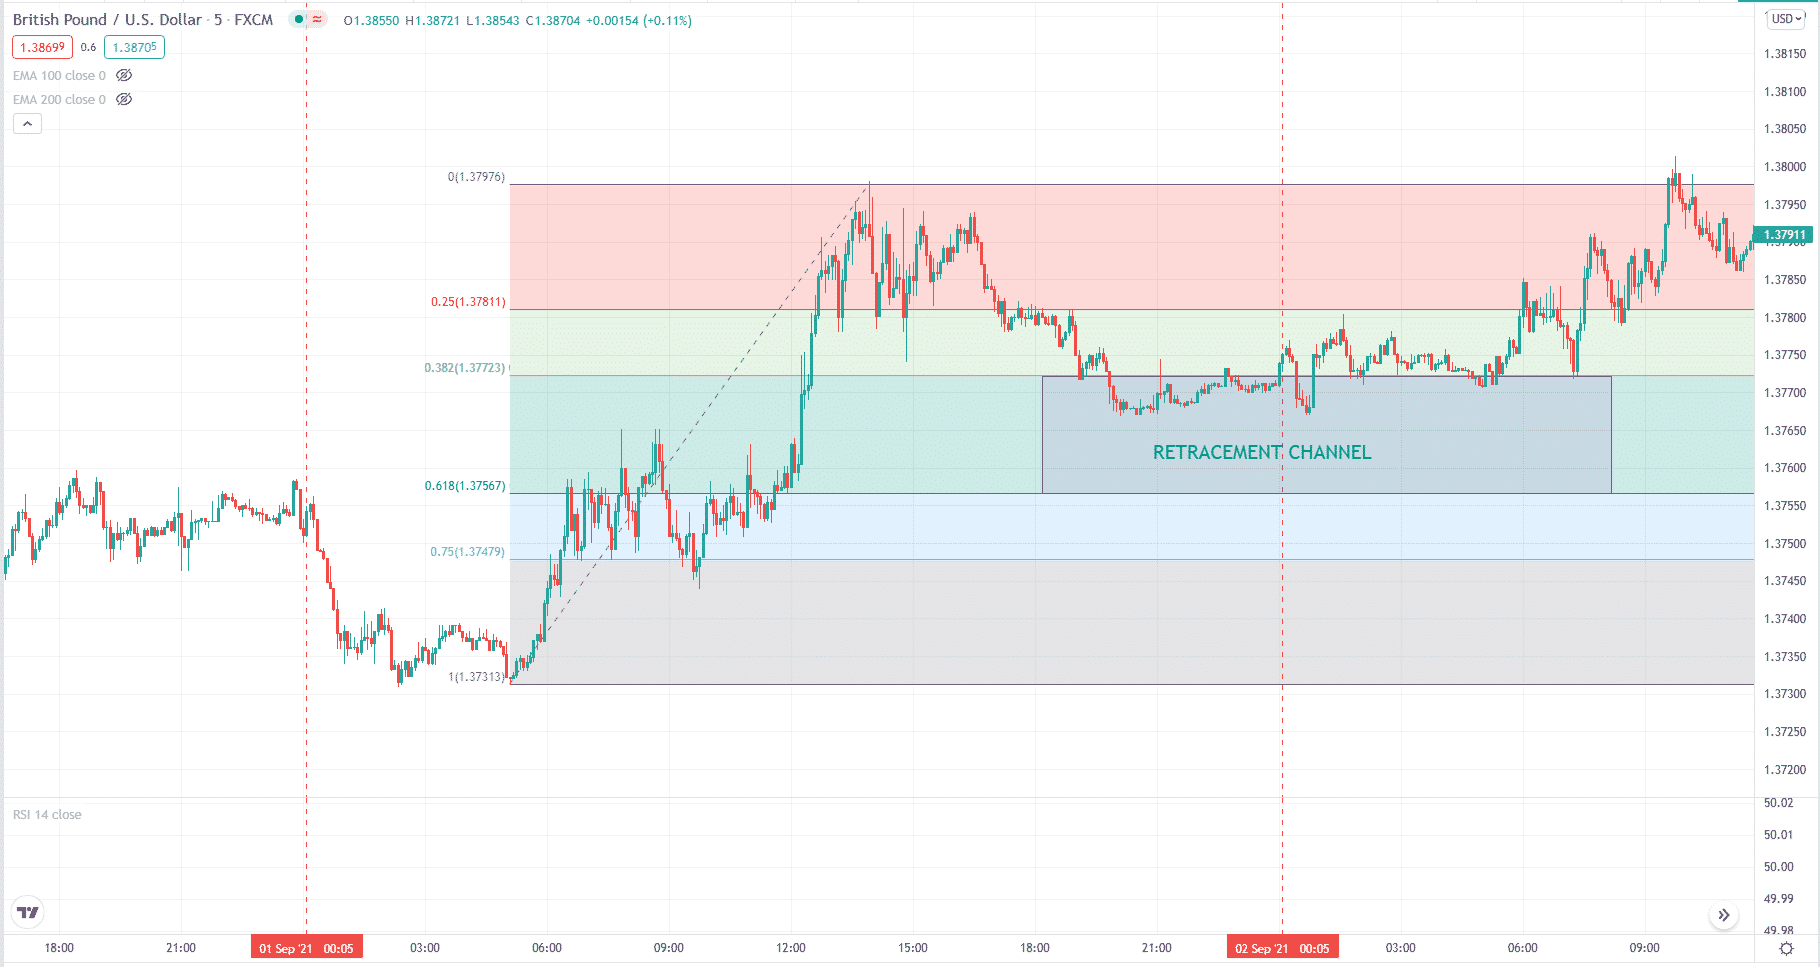
The Fibonacci levels will play important roles in this strategy. First, we use it to define the retracement channel. The 38.2 level will serve as the lower retracement level, and the 61.8 level will serve as the upper retracement level.
The retracement channel is the channel between the upper and the lower retracement levels.

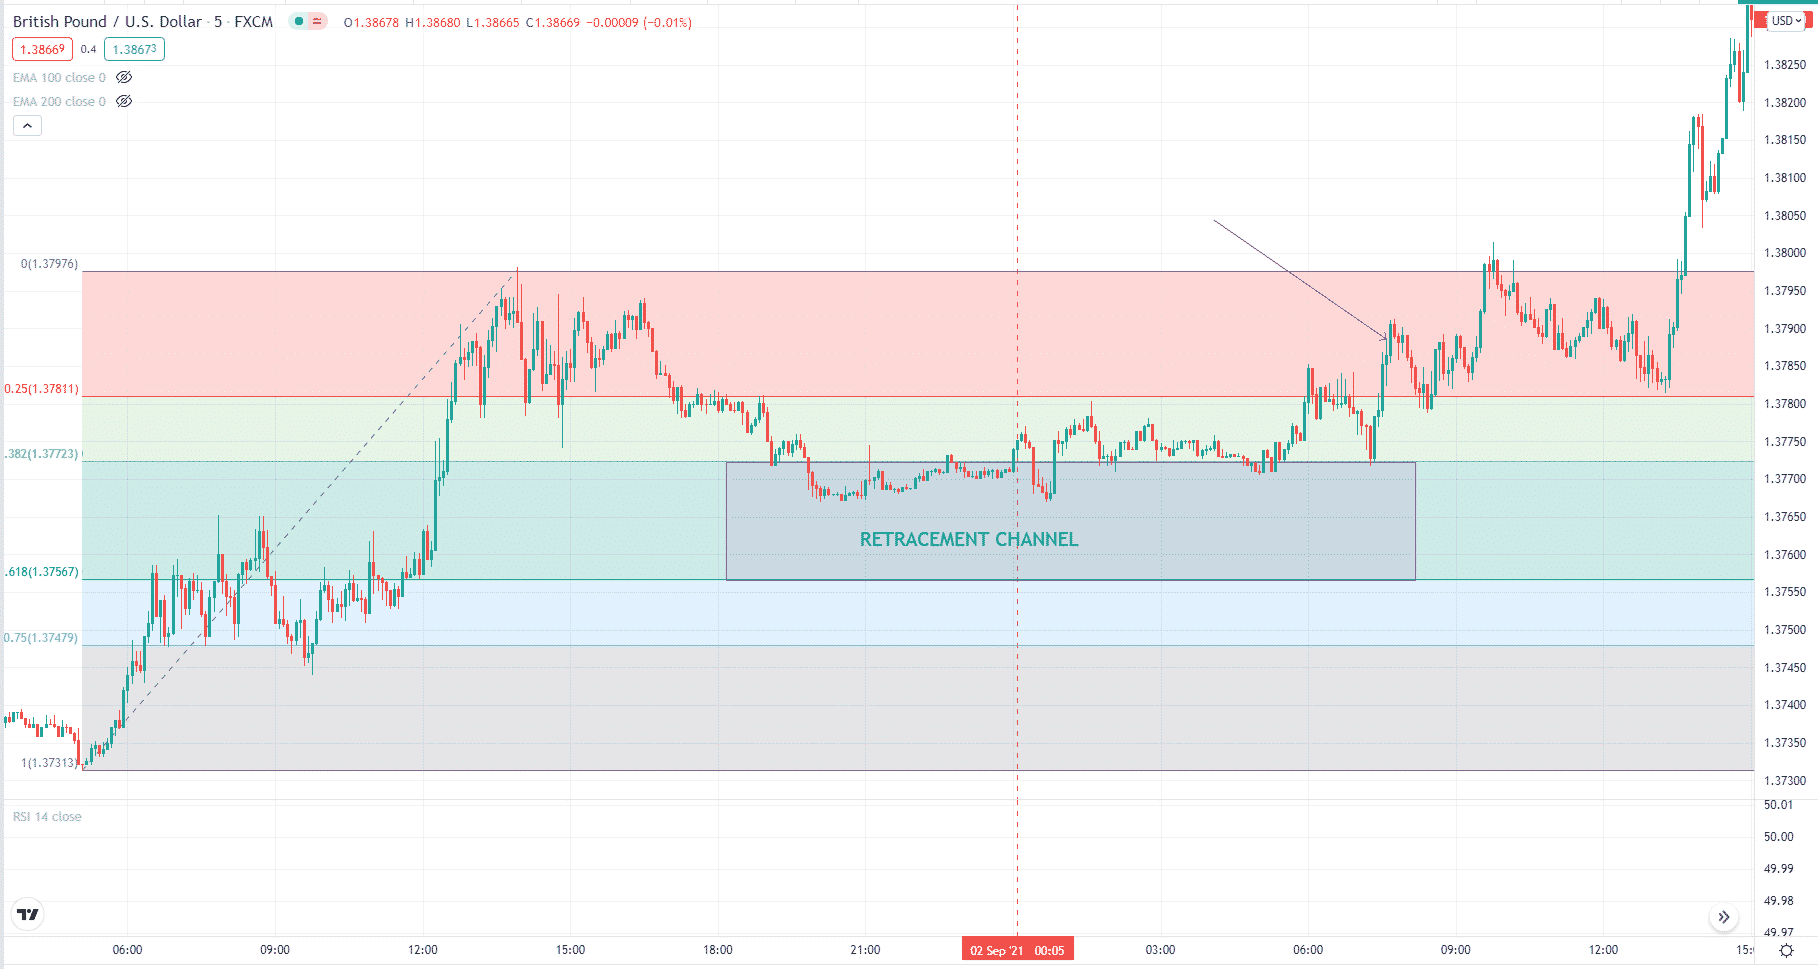
Meanwhile, the 25 level acts as the lower confirmation level for sell entries, and the 75 level acts as the upper confirmation level for buy entries. Take note that the values of 25 and 75 levels may change depending on where you put the first and second points of the Fibonacci tool.
These levels may change places, but be aware that a breakout of the lower confirmation level is a signal for a short entry, and a breakout of the upper confirmation level is a signal for a long entry.
Activate the retracement channel
After plotting the Fibonacci tool, we focus our attention on the retracement channel. While the price is outside the channel, whatever it does will not interest us. The moment it enters the channel, all attention should be centered on the ensuing price action.
Once the price enters the channel and closes there, the channel has become active. After this, you want to know if the price will break below or above the confirmation level. The following two cases are possible:
Case 1: Active wave is an impulsive wave.
If the active wave goes up as in this example and a full candle goes above the upper confirmation level (75%), that wave is impulsive. Remember that impulsive waves go in the direction of the market trend. As the trend of the wave is bullish (as it is going up), it gives us the information that the actual market trend is bullish. We get a bullish signal. See the image below.

Case 2: Active wave is a corrective wave.
If the active wave is going up as in this example and a full candle goes below the lower confirmation level (25%), the active wave is a corrective wave. Remember that corrective waves go against the direction of the market trend.
Confirm entry with RSI
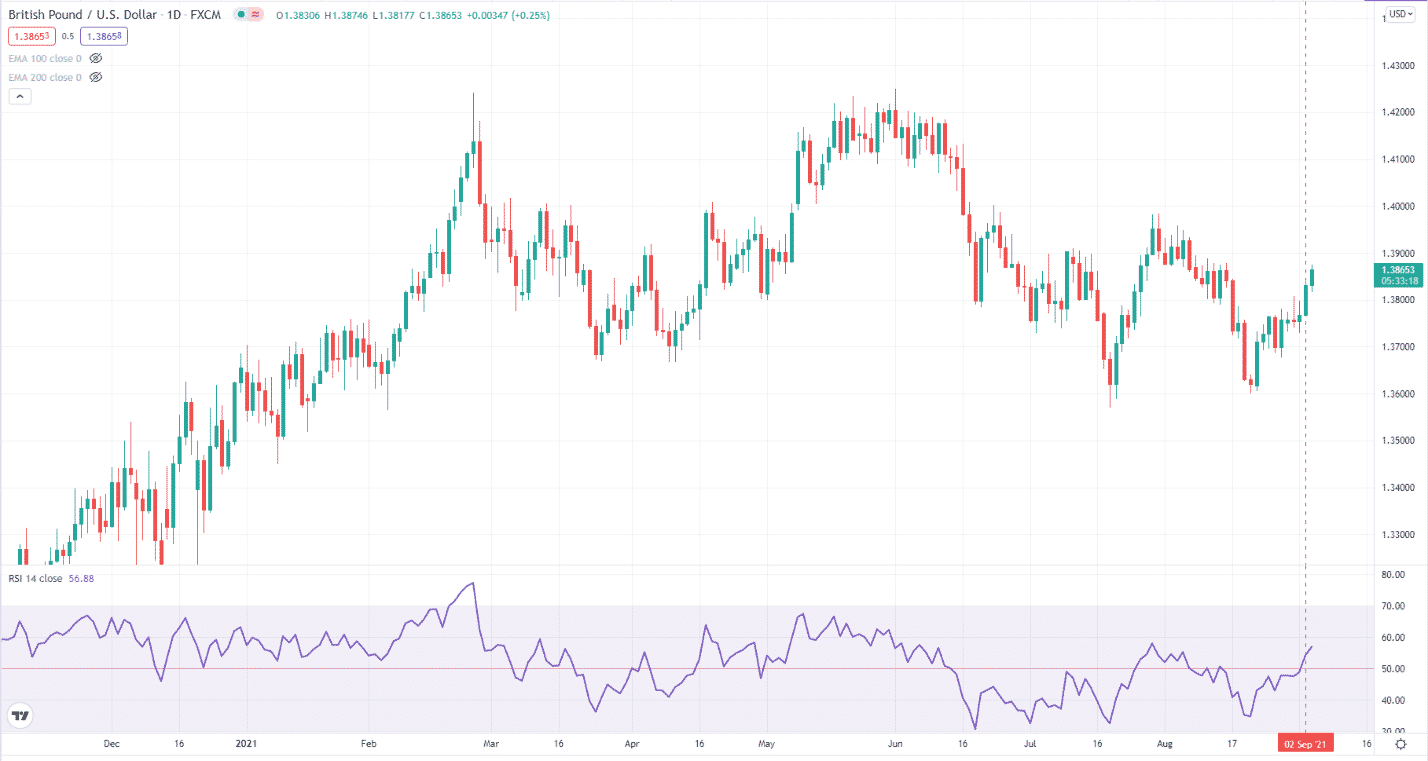
If the signal generated by the ICWR is bullish, as in this case, we must check if RSI is greater than 50. If that is so, then we can open a long trade. If the signal generated by the ICWR is bearish, we must check if RSI is less than 50 before we open a short trade. If the ICWR signal is not in sync with the RSI sentiment, do not open a trade.

As you can see on the GBP/USD daily chart above, RSI is already above 50 when a full candle closes above the upper confirmation level. This means that the ICWR signal is in sync with the RSI sentiment, so a long trade is confirmed.
When to exit a trade
Our primary exit strategy is to look for an opposite signal (opposite to our entry signal) based on the ICWR concept. This means that when we have taken a long trade and the price makes a correction but does not break below the lower confirmation level (25%), we can keep the long trade open. Otherwise, we exit the position with a profit.
For the sake of capital preservation, after entering a position, make sure to place a protective stop of 50 pips, which is the maximum risk we are willing to take on each trade using the ICWR strategy.
Final thoughts
The ICWR strategy is an exciting strategy whose approach to identifying a trend is unique. If you are a price action trader, you would love this strategy. Test this strategy further through hand testing or demo trading to see if it means something or suits your trading style.


