The pennant pattern strategy is one of the basic methods used in FX to read the behavior of the market. Even when the pennant strategy is about the trend lines formed by the closing prices, it is often more precise when combined with other indicators. This price action strategy could make you earn a lot of money once you master it.
This technique is one of the favorites of technical traders, especially those who don’t get along with indicators like RSI, MAs, or oscillators.
On the other hand, price action indicators are a great way to read the market. So, even the less experienced traders can make a profit out of this. Let’s improve your technique and make a profit with the help of the pennant pattern strategy.
What is the pennant pattern strategy?
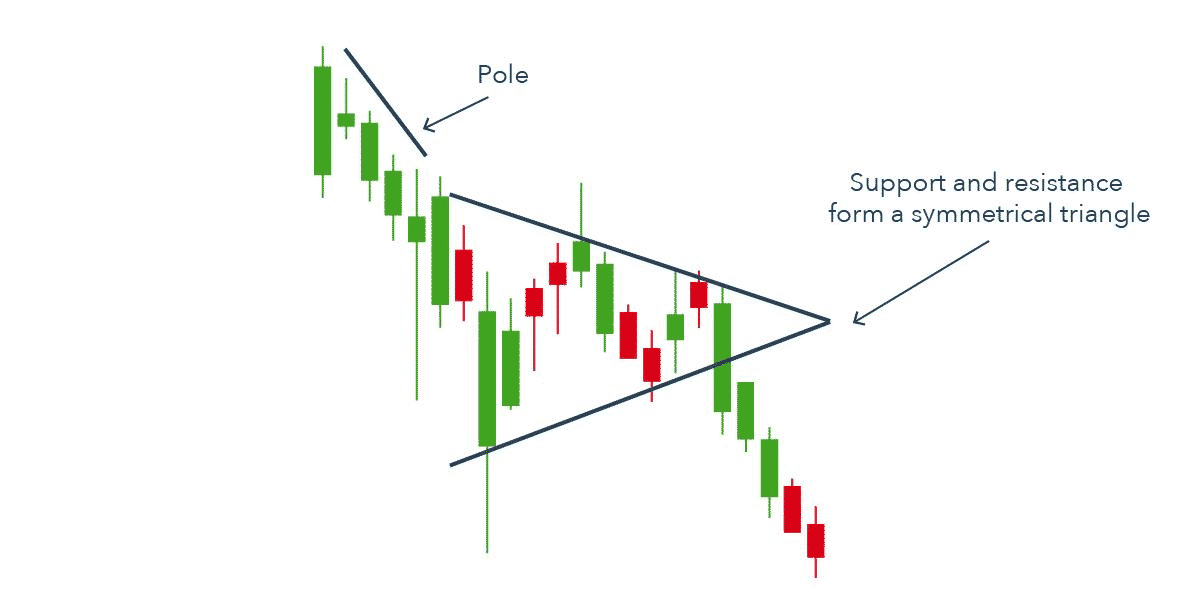
It is called that way due to the figure you draw in the chart to recognize the pattern. Flags and pennants are similar, but unlike flags, in the consolidation phase of pennants, the resistance and support levels converge at the end.
The parts of the pennants are:
- The flagpole
It is the initial long trend that “holds” the pennant in the figure.
- The pennant
It is the consolidation phase in which the price moves between the resistance and support levels. But in this consolidation phase, you get lower highs and higher lows until the trend lines converge and the breakout occurs.
- The breakout
It is when the price starts trending again in the same direction that the flagpole.
The great thing about these patterns is that it gives traders who didn’t benefit from the initial trend the opportunity to benefit from the breakout. Traders who profited from the beginning keep making money after the consolidation phase is over.
How to trade with this strategy?

It seems like the way to trade this pattern is very straightforward, but the truth is that, like many other things in the trading world, there is not just one way of doing things right.
Starting with the time frame, you use the strategy. You can make many different choices according to your preferences. It also depends on what type of market you are in.
The pennant pattern works for both bullish and bearish markets. While each trader is different in their approach to every situation, you can use some general guidelines to use this strategy. Next, we will see the key points to perform a successful strategy.
Bullish trade setup
The direction of the trend is up here. We would like to benefit from the entire uptrend, from the flagpole base to the end of the breakout. But strictly speaking, you can only use the pennant pattern after seeing the flagpole and the pennant. Thus, if you are in the trade before the pennant, that’s great, but it wasn’t because of the pennant pattern since there wasn’t one yet.

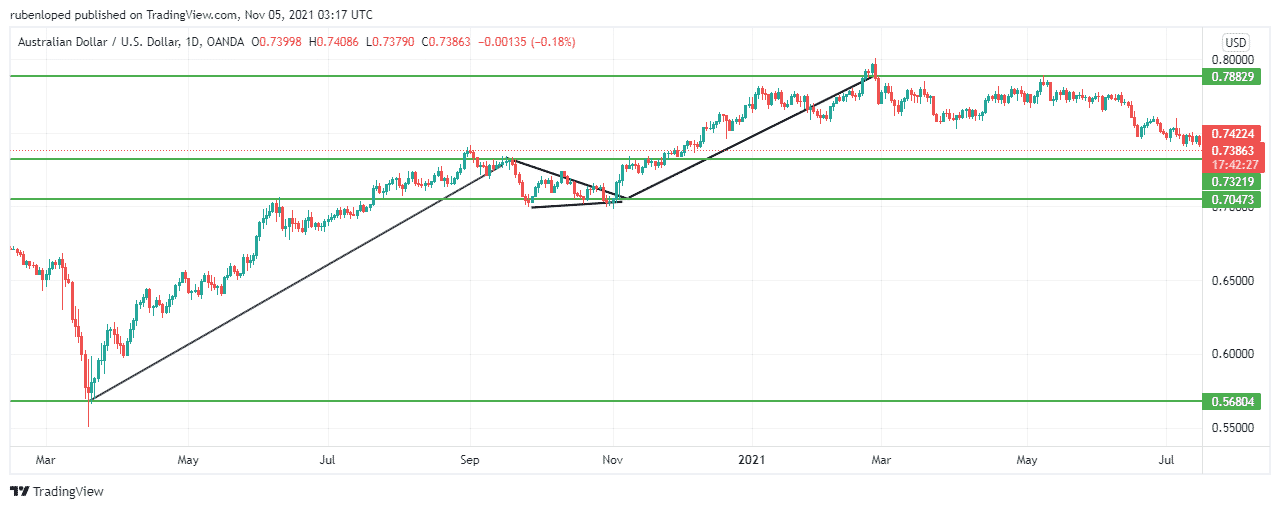
In the chart above, we see a pennant pattern in the AUD/USD chart. The important thing is that the pattern is never as ideal or educational as the images show you.
Entry
Make an entry when the pennant finalizes and the breakout occurs. Following the slope of the support and resistance levels, you can estimate the level at which the breakout will happen.
Initially, the flagpole goes up to 0.73; the price goes up and down until a breakout occurs around 0.70.
Once you forecast that the breakout will happen around that level, you place a buy order around, let’s say, at 0.71, and the system will enter the position you want automatically.
Take profit
The most common recommendation is to set the take profit level, considering the difference between the flagpole base and the pennant’s final level. For this case, the first magnitude was 1370 pips. Instead, we recommend using 50% of that magnitude. That way, the take profit level should be around 685 pips.
Bearish trade setup
The bearish setup follows the same principles of the bullish setup, but in a bearish market. You can keep making money even in bearish markets without risking significant amounts due to excessive leverage. For some people, it could be a little harder to identify pennants patterns in bearish markets. Let’s see how the setup is for this case.

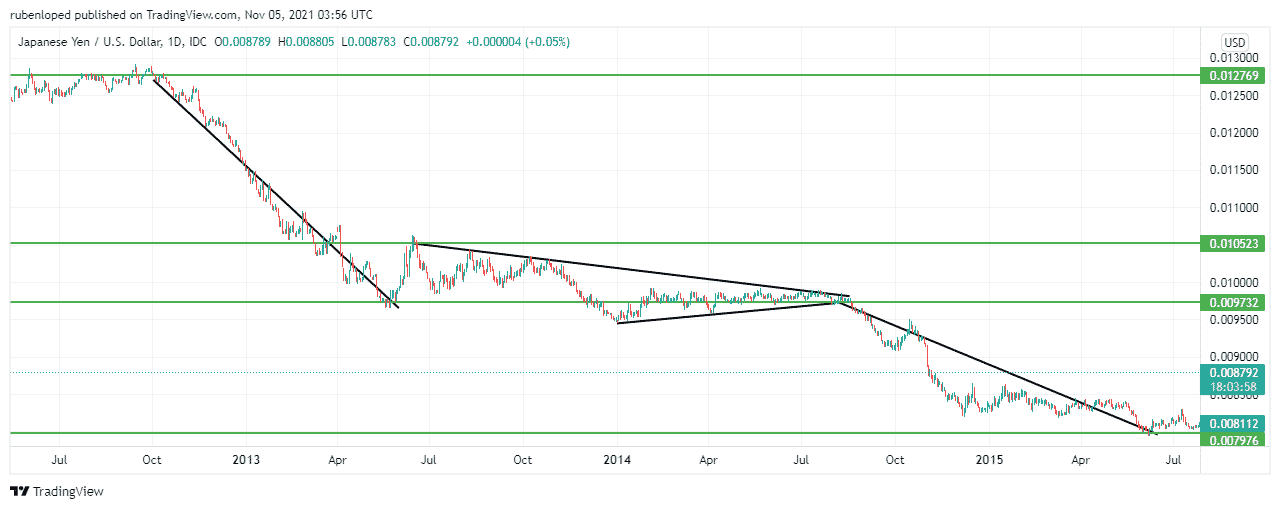
We can see in this chart how a pennant pattern is formed in the JPY/USD pair. Again, to see the pattern, we had to adapt it a little, and the support line began later than the resistance. That way, we were able to identify the pattern and make the right move.
Entry
The flagpole base is at 0.012769, and the consolidation phase represented by the pennant is at 0.009732. Once the trade predicts the level at which the breakout will happen, the trader has to set the buy order below that level to make sure he doesn’t fall into a false breakout. A level around 0.009600 would be just fine.
Take profit
We will follow our 50% rule. Since the flagpole was 305 pips long. So a proper target would be then something around 150 pips.
How to manage risks?
There are several ways in which you could manage your risk when trading with the pennant pattern strategy. Let’s see some of them:
- Stop-loss
These levels are the most common ways of managing your risk. Using more advanced techniques like trailing stop-loss is also a great choice.
- Time frame
With this and any strategy, the signals are stronger when you see the pattern in longer time frames.
- Use other indicators
The most used indicator with this strategy is volume. You want to see high volume in the flagpole, low volume in the pennant, and high volume in the breakout.
Final thoughts
This is one of many strategies used for traders who trust the price action indicators to make their trading choices. The strategy’s effectiveness sometimes depends more on your ability to read the market than the strategy itself. As you can see in the example, the pennants are not as perfect as you may want. Gaining expertise will help you to see the patterns faster and better.


