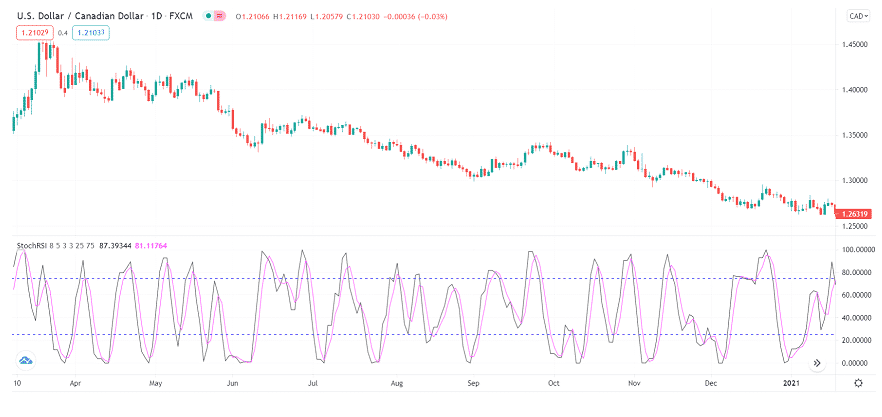
You may have heard about oscillators like Stochastic and RSI, and you may have used both in your trading separately. However, another indicator in the market combines both indicators and acquires the best combination of the two. So let’s learn more about it.
What is StochRSI?
It was first introduced to the world in 1994 in a book called “The New Technical Trader.” Stanley Kroll and Tushar Chande are the authors of the book. The tool derives value from Stochastic and is applied to RSI. The resultant indicator is called StochRSI that fluctuates between 0 and 100.
The purpose of the tool is to take the benefit of both Stochastic and RSI with one indicator. As a result, it is more responsive to the price change. Moreover, unlike other oscillators, it does not only cater to the current price change. Instead, it considers the historical performance of the trading instrument.
On the 0 to 100 scale:
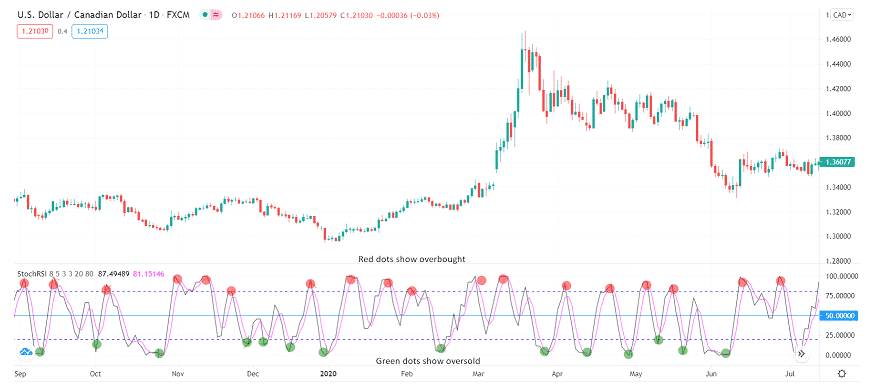
- 20 and below is an overbought zone
- 80 and above is an oversold zone
However, these overbought/oversold zones do not necessarily mean the reversal of a trend. Instead, these values indicate that the indicator is close to its current extremes.

How to calculate StochRSI?
Although the charting tools automatically plot the indicator on your chart, you should know its logic to understand the application better. So here’s the formula to calculate it.
StochRSI = (RSI – lowest RSI)/max RSI – lowest RSI
Take the following steps to calculate it:
- Compute RSI value for 14 periods.
- Observe the current, high and low values of RSI at the fourteenth period. Now you may have all the inputs to place in the formula of StochRSI.
- Observe the current, high and low values of RSI again at the fifteenth period. However, exclude the fifteenth period and include only the last fourteen. Now compute the new StockRSI.
- Since each period calculates a new value for StochRSI, including only the 14 RSI values.
How to use StochRSI effectively?
You can use the tool for two key objectives:
- Identification of a trend
- Identification of a potential trend reversal
The three central values of the tool are 20, 50, and 80.
The 20 mark
It is a mark where sellers seem exhausted and may not push the further price downside. You can search for buying opportunities when the tool hits 20 or below. However, this is not a blind buying opportunity. You should further see support, resistance, and other technical factors for confirmation.

The 80 mark
Similarly, you can point out an overbought scenario through the StochRSI when it hits 80 marks or above. It shows that the price has reached its maximum level, and it may not pursue the trend further without retracement. Here, you can look for potential selling opportunities. However, try to keep the risks limited as there could only be a mild retracement rather than a trend reversal.
The 50 mark
Now comes the use of this tool to identify whether a trend is bullish or bearish:
- If the indicator value is below 50, it reveals a downtrend
- If the indicator value is above 50, it shows an uptrend
- The 50 mark acts as a pivot point
Stoch vs. RSI, which is better and more useful?
Let’s compare both indicators to find out what’s better.
- The application and design of both the momentum indicators are different; however, they serve the same purpose to find the trend continuation or reversal.
- The underlying methods are different to compute both indicators. RSI is used to determine support, resistance, or divergence in the market, while Stoch is used to find trend reversal from potential areas with another line (3-period moving average).
- The intersection of two lines can indicate a trade opportunity. Stoch responds faster to the price change than RSI. However, it has more noise and choppiness as well. That’s why RSI performs better in trending markets while Stoch performs well in consolidating or retracing markets. Most technical traders prefer using RSI over Stochastic.
Although both the tools serve a similar purpose, their computation formula is different.
- Stochastic stems from the RSI, while it uses the price of an asset. You can say Stochastic is the second derivative of price. RSI does not move quickly from overbought to oversold zones.
- On the other hand, Stochastic shuffles rapidly between the zones. Hence, the core difference lies in the reaction to price velocity. As a result, Stoch works better when the price maintains a broader range, and in case of a sharp trend, it may trigger many false signals.
- Contrarily, RSI works well when the price breaks out of range and trends in either direction. Since it reacts slowly, you may not find many spikes or choppiness in the indicator. However, you may miss an excellent trading opportunity as well.
Limitations of using the StochRSI
Since the indicator is the second derivative of the price, it remains unaware of the price change. Thus, you may find it out of synchronization with the market price in some instances. Another limitation is the quick reaction of the indicator to price change. As a result, it may create a lot of noise and false signals.
You can cope with this issue if you try to smooth out the indicator. It can be done using the moving average. For instance, you can use a 13-day moving average to remove noise in the indicator and filter out fake signals.


