Using chart patterns to define precious trading positions is common among financial traders. These patterns or price formations enable making more accurate trading positions besides increasing profitability. The rectangle pattern is one of the remarkable patterns of the classical chart pattern family.
However, there is no alternative to learning the functionality and formations of any specific pattern before using it to get complete benefit from that pattern. This article will introduce you to the rectangle pattern, which includes trading strategies with chart attachments and listing the top pros and cons.
What is a rectangle pattern?
You get a technical formation of price movement by adding lows and highs during price consolidation after a solid upward or downward price movement. A specific condition is the high and lows will touch the whole shape at least twice. Means two highs and lows will touch the rectangle shape on the upside and downside. This pattern includes illustrating lows and highs horizontally to complete the shape of a rectangle.
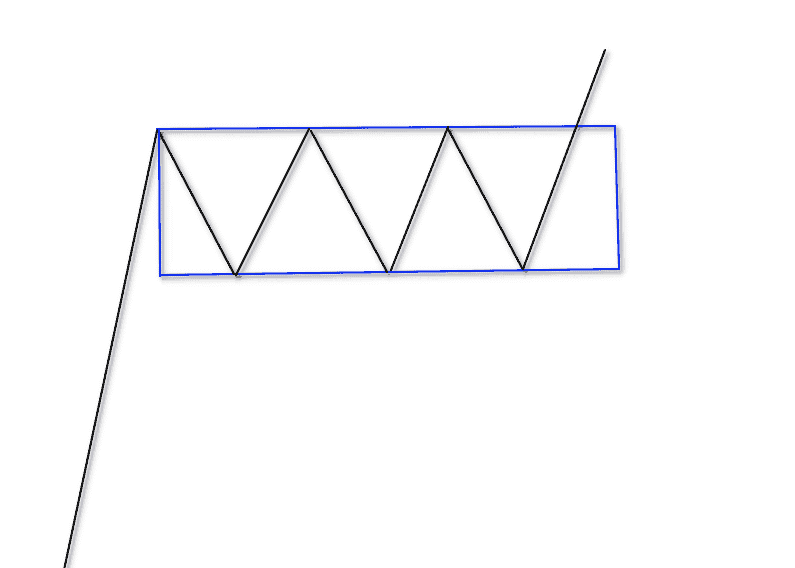
Two types you will find at any consolidation or sideways piece movement of a significant trend.
The bullish rectangle
You can easily find it on an uptrend when the accumulation or distribution takes place on a significant bullish trend. It signals the continuation of the current trend when the price breaks the range of the rectangle shape on the upside.
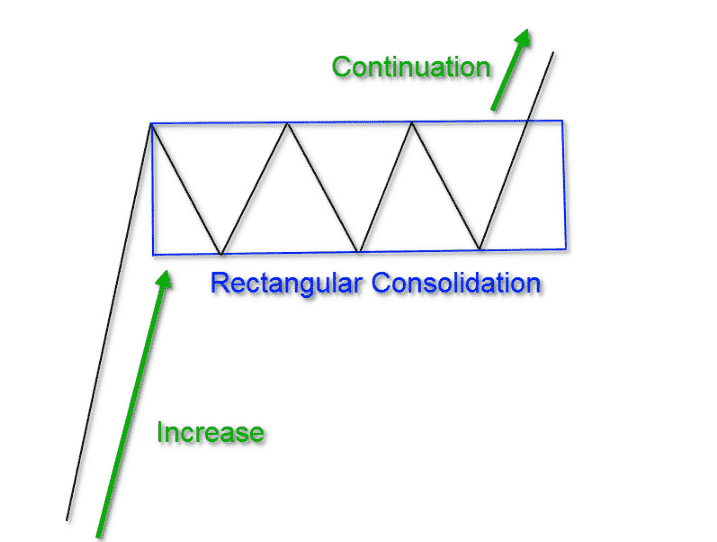
Illustrating the highs and lows horizontally, the shape of this figure will take place.
The bearish rectangle
Its shape will appear on a downtrend when the accumulation or distribution. It signals the continuation of the current trend when the price breaks the range of the rectangle shape on the downside.
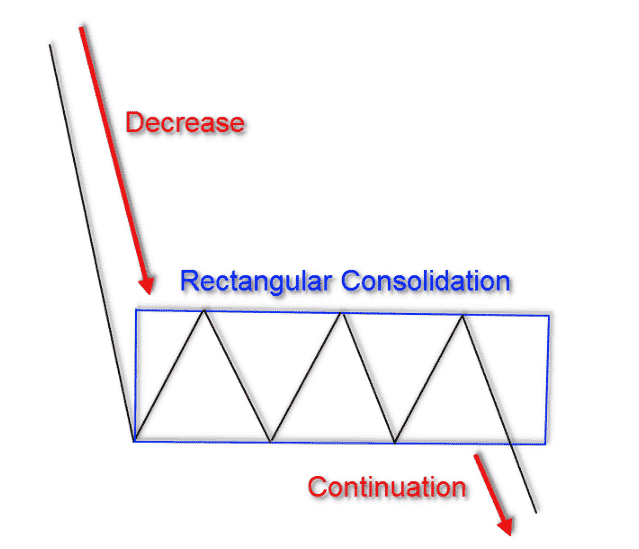
You will get the rectangle by illustrating the highs and lows horizontally during the formation of this pattern. Every time the price comes outside of the rectangle, it creates opportunities to price action traders.
How to trade using rectangle pattern
Trading is simple with this pattern. Follow these steps below to trade successfully using any rectangle pattern.
Step one
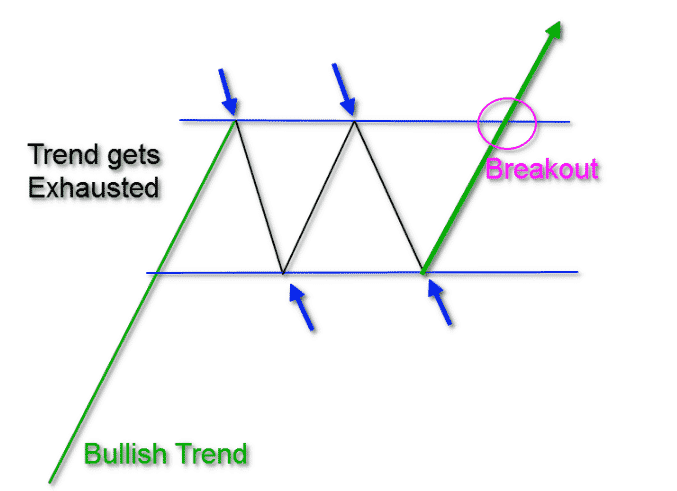
In the first step, identify the pattern during a sharp price movement. Remember, parallel highs and lows complete the shape. When you determine the shape, wait till the price remains between the rectangle range.

The figure above shows the formation of a bullish rectangle.
Step two
In this step, the price may break above or below a bullish or bearish rectangle. Place buy/sell orders after a valid breakout. It’s the time when you enter the market. For a clear understanding, look at the figure below.
Step three
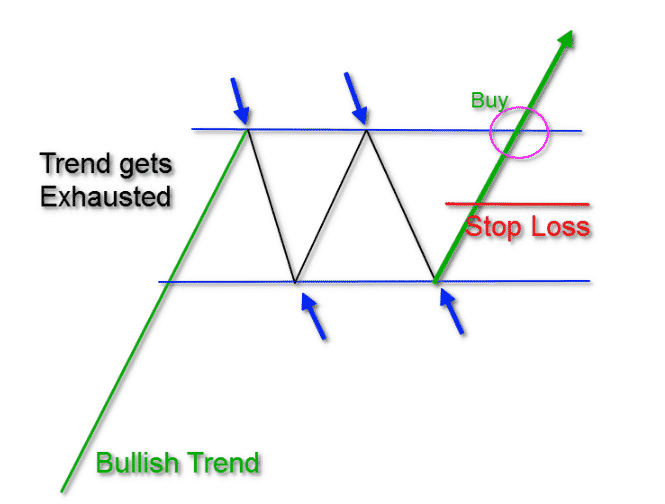
In the next step, secure the order by placing stop loss. For buy orders, place an initial stop loss below the middle of the rectangle shape with a buffer of 10-15pips. Inversely for a sell order, place stop loss above the central level of the rectangle. The figure below shows the stop loss level for the bullish rectangle.
Step four
It is the last step to set a profit target. The profit target will be above or below the same range as the rectangle as this pattern generates trade ideas of continuation so the profit target can extend more. The yellow line of the figure below shows the profit target area for a bullish rectangle.
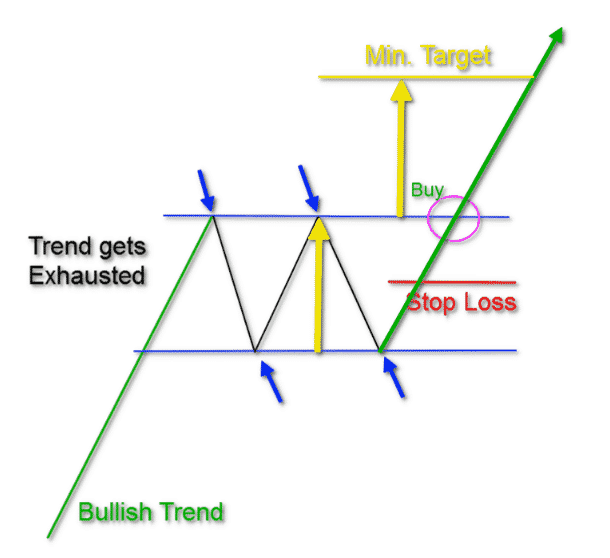
This trading technique suggests trades with a 1:2 risk ratio.
Bullish trade scenario
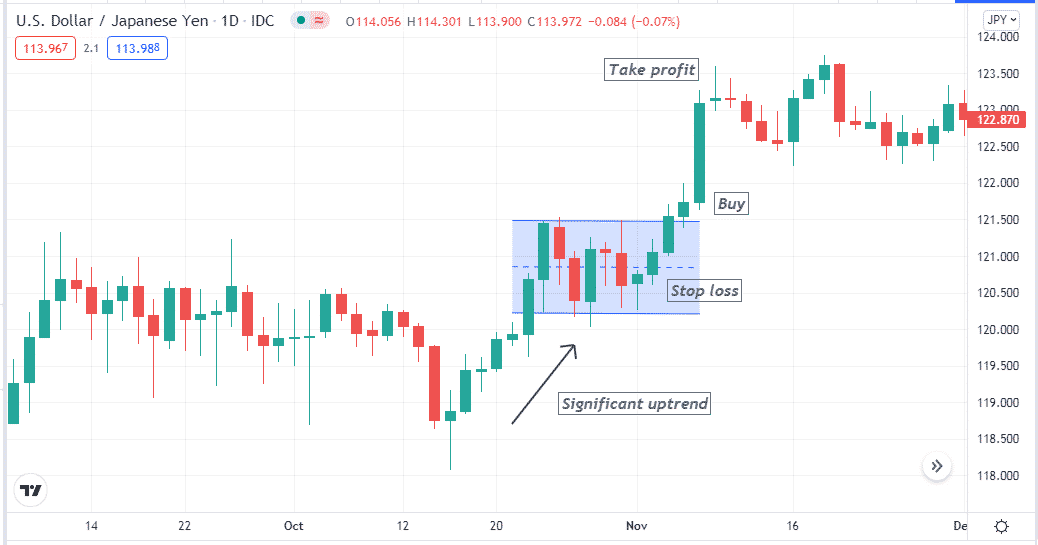
This trading strategy applies to any time frame chart. We suggest using charts of H1 or above to make considerable profits from executing trades. Remember big chart will always give you ample ideas, and a birds-eye view of any asset will allow making constantly profitable trades. Determine the rectangle after the price completes a sharp uptrend and wait till a valid breakout occurs. Better wait till a candle completes formation outside the box on the upside.
Entry
Place a buy order when the bull candle closes, and the price comes near the rectangle.
Stop-loss
The initial SL will be below the center level of the rectangle.
Take profit
The profit target of the buy order will be above the exact distance of the rectangle shape. You can continue the buy order if the price continues to increase and the trend remains intact.
Bearish trade scenario
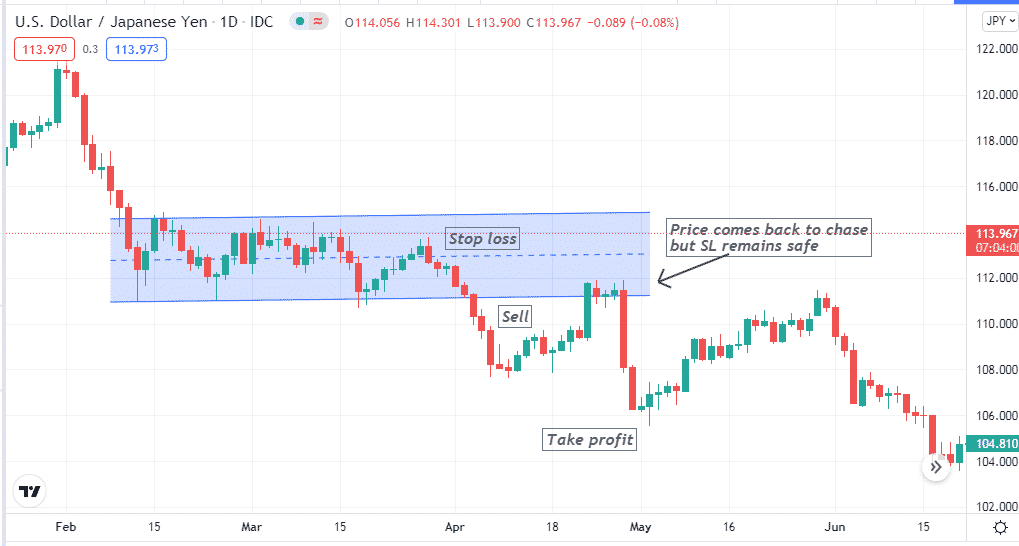
You will find sell opportunities when the price consolidates after a sharp bearish movement. Draw the rectangle and wait till breakout occurs by the price movement. When the price reaches below the range of the figure, it’s time to place orders.
Entry
When price breaks below the rectangle range, place a sell order after the first bearish candle outside completes formation.
Stop-loss
Place a SL to secure the sell position above the central level.
Take profit
The profit target of your sell order will be below the exact distance of the rectangle size.
Trade management tips
Some factors are essential to remember to trade using this pattern, such as:
- The trading technique generates trade ideas of a 1:2 risk ratio, so use proper SL to secure your capital.
- You can continue your buy/sell orders more than the rectangle size till the current trend remains intact or solid price movement continues.
- We suggest shifting SL above or below the breakeven level for buy or sell orders if you continue your trading position.
- Avoid trade using this pattern during any significant micro or macroeconomic news releases.
- Try to confirm the trend from upper timeframe charts. Don’t forget to have a birds-eye view of the target asset.
- You can combine other technical tools and indicators such as Fibonacci retracements, support resistance, MACD, RSI, MA, etc., with this chart pattern to identify more accurate trading positions.
Final thought
Finally, we briefly explain trading techniques using this pattern with chart attachments in this article. We hope you find it sufficiently educational and informative to use rectangle patterns for your trade executions. We recommend using demo charts first to master the concept. In this way, your capital will be safe.
