Price candles are a helpful element in the financial market to determine the market context. So it is a typical practice among market participants to use candle formations while making trade decisions as it enables profitability. Candlestick patterns signal both continuation and reversal in different phases of price movements.
However, it is mandatory to learn the complete formations to combine candlesticks with other technical/fundamental tools and indicators to execute profitable trades. This article will reveal some of the most common candlestick patterns besides explaining trading techniques using those patterns.
What is a reversal candlestick pattern strategy?
Traders have been using Japanese candlesticks for over three hundred years. Meanwhile, it has only become popular in the western world for the last half-century alongside the availability of technology and online brokers. Bar chart trading has widely been replaced with the increasing popularity of candlestick charts as it offers better visuals on many time frames. The author of ‘Japanese Candlestick Charting Techniques’ is Steve Nison, who has comprehensive credit to make candlestick chart trading popular.
Moreover, many patterns generate trade ideas frequently during price movements and signal the same on any trading asset chart.
There are two types of reversals:
- Buying and selling are when the price is going lower, it turns to the upside.
- On the other hand, when the price rises, it turns to the downside, which is a bearish reversal.
The best five candlestick patterns are.
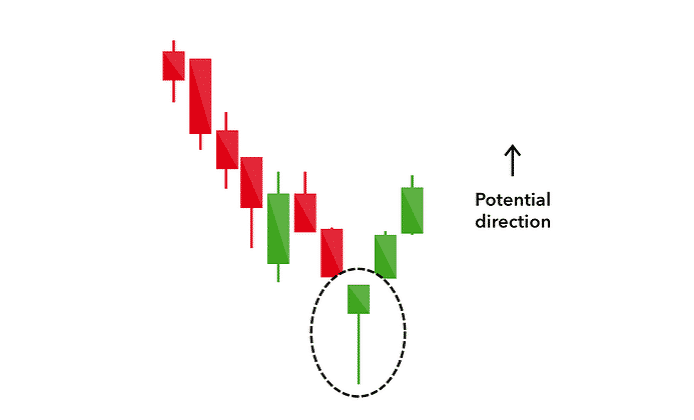
The hammer
You can consider the hammer a common reversal candle formation that looks like a pin with a tall lower wick/shadow and a petite body. The long lower shadow declares aggressive selling pressure, and closing above the opening price declares that the buyers take over the price by ending. It usually generates a bullish reversal by taking place near support levels.
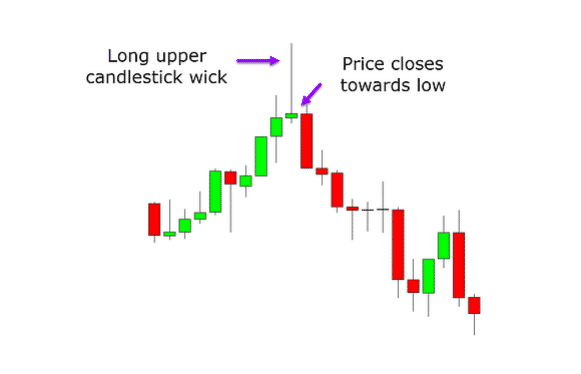
Shooting star
Shooting star candles have the exact opposite appearance of hammer candles, which signals a possible declining pressure or bearish reversal near any resistance level.
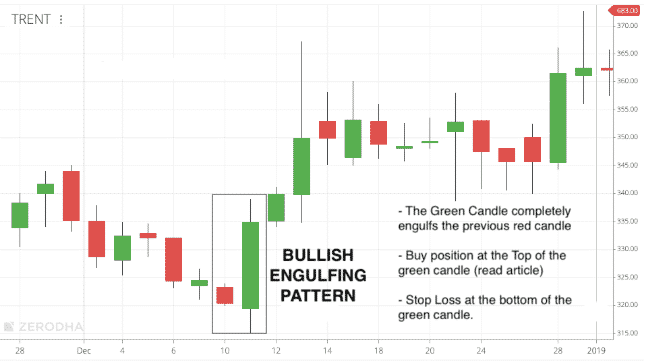
Bullish engulfing pattern
Multiple candlestick formations where the primary candle is bearish and the subsequent is bullish. When these two candles appear near any support level, it signals a possible upcoming bullish reversal.
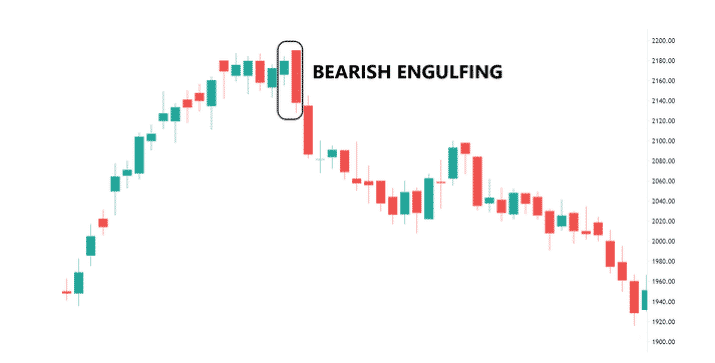
Bearish engulfing pattern
It has the exact opposite appearance of the bullish engulfing pattern. That signals possible bearish reversal by taking place near any resistance level.
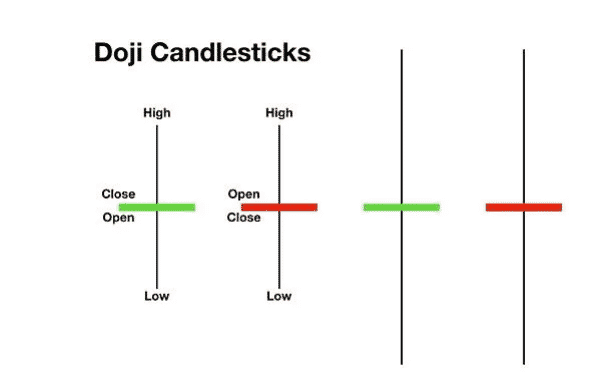
Doji
You can consider the Doji candles as identical: a single candlestick pattern with no or very little body and wicks on both sides of the body. It generates reversal signals by appearing on many adequate levels.
Traders also use many multi candle formations to determine potentially profitable trading positions.
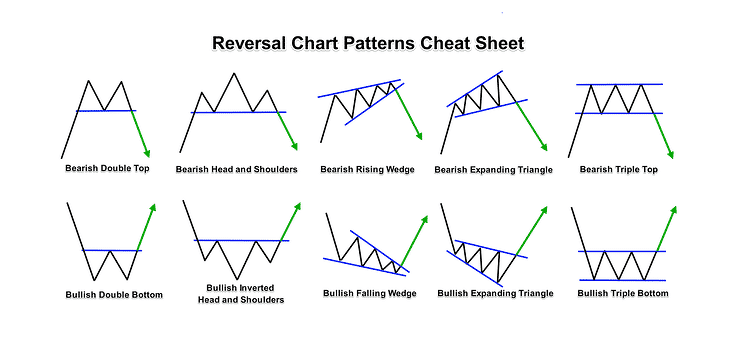
Any trading strategy that contains any reversal candlestick concept to generate trade ideas is a reversal candlestick pattern strategy.
How to trade with reversal candlestick pattern strategies?
Trading with a single candle formation is not a wise decision. Follow the steps below to execute successful trading using reversal candlestick patterns:
- Spot any reversal candle formation near adequate levels.
- Combine that candlestick pattern with other technical indicators or tools.
- Place trades according to your methods.
- When the price reaches your profit target or your method suggests exiting, close your position.
Our trading method uses the MACD indicator and HMA of 20 periods alongside reversal candlestick patterns.
Bullish trade setup
When you seek to open a buy position, spot a bullish reversal candle near any support level. Then observe:
- The dynamic blue line crosses above the dynamic red line on the MACD indicator window.
- MACD green histogram bars take place above the central line.
- The HMA line is sloping on the upside.
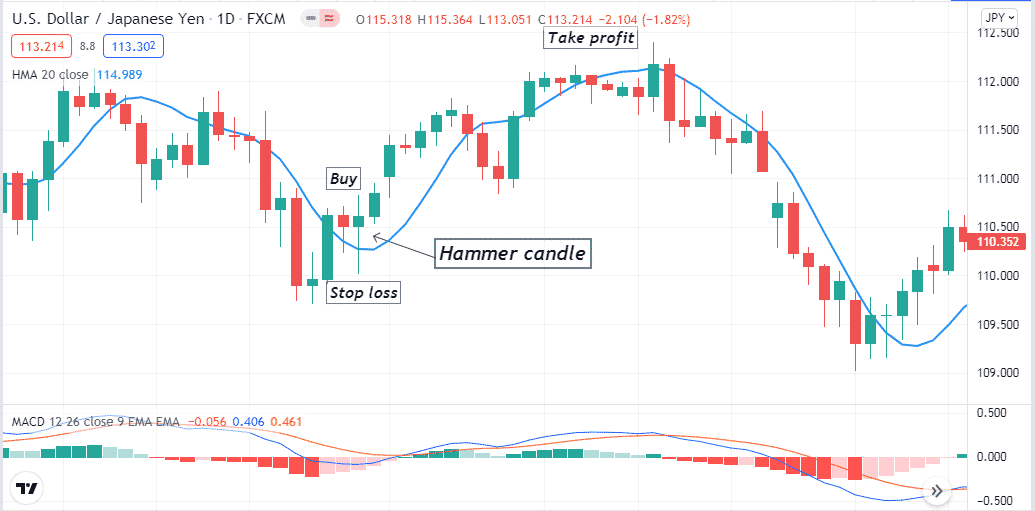
Entry
When these conditions above match your target asset chart and the price stays above the HMA line, open a buy position.
Stop loss
Place an initial SL below the current swing low of the bullish momentum.
Take profit
Close the buy order when:
- MACD red histogram bars appear below the central line.
- The HMA line starts sloping on the downside and closing below the price.
Bearish trade setup
When you seek to open a sell position, spot a bearish reversal candle near any resistance level. Then observe:
- The dynamic blue line crosses below the dynamic red line on the MACD indicator window.
- MACD red histogram bars take place below the central line.
- The HMA line is sloping on the downside.
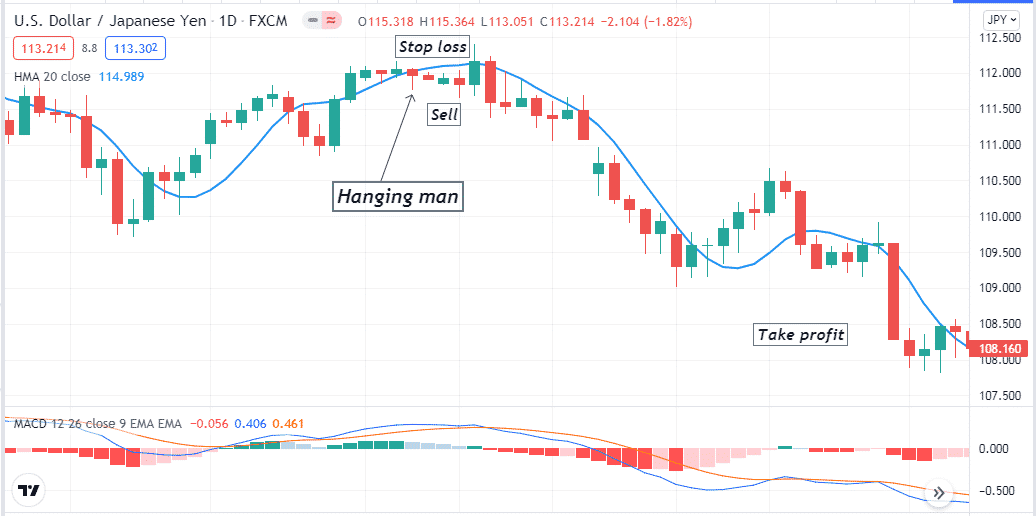
Entry
When these conditions above match your target asset chart and the price stays below the HMA line, open a sell position.
Stop loss
Place an initial stop loss above the current swing high of the bearish momentum.
Take profit
Close the sell order when:
- MACD green histogram bars appear below the central line.
- The HMA line starts sloping on the upside and the price start closing above it.
How to manage risks?
In this part, we list the professional risk management tips, which are as follows:
- Don’t make early entries combine indicator readings before opening trades.
- When using reversal candlestick patterns for trading, checking on upper time frame charts will give you an idea of the actual price direction. Moreover, you can avoid fake swing high/lows of lower time frame charts.
- Before opening trades, check on the economic calendar to avoid making trades during any significant fundamental news release. Any reversal pattern method can fail due to trend-changing economic events.
- Use proper stop loss for every trade you execute, don’t risk more than 2% of your trading capital for open positions.
Final thought
You can use any reversal candlestick pattern as a key indicator to determine the trend-changing levels, either an uptrend or a downtrend. It is wise to use other technical tools and indicators such as MAs, MA crossovers, RSI, ADX, Fibo retracements, pivot points, etc., as confirming indicators while making trade decisions and determining precious entry/exit positions.


