If you think RSI has lost its usefulness as a trading tool, think again. Using the RSI in a way most users do might not have served you well in the past, but there is a better way to implement the RSI. That is what you will learn in this article, so read on.
What is RSI?
Technical traders use the RSI to measure market strength and momentum. So yes, just by looking at the RSI line as it fluctuates, you can get helpful information about the direction and health of the current trend.
As an oscillator, RSI values range from zero to 100:
- Market participants consider the underlying market to be overbought/overvalued when the RSI value goes beyond the 70 level.
- Speculators believe a market to be oversold or undervalued when RSI goes below the 30 level.
Anytime the RSI becomes overbought, you will get a signal for sell entry. Meanwhile, if the RSI becomes oversold, you will get a buy signal. This is the traditional way of using the RSI for trading.
Because markets can stay overbought/oversold for a long time before a trend reversal may occur, traders have adopted a new mindset regarding trading signals.
The new method is to take signals in line with the overall trend and ignore calls counter to the trend. This idea meshes with the age-old concept of trend continuation in Dow theory. The essence is to assume that a trend will continue, then reverse and take the trades only when the reversal has started.
It appears that this theory stands the test of time. However, until now, traders can still find value in considering this concept in their trading. Therefore, trading the RSI with the overall trend direction in mind is the way to go.
History of RSI
Market technician J. Welles Wilder developed the RSI in 1978. He postulated that when price moves up/down very quickly, at some point, it will become overvalued/oversold, resulting in either a reversal or correction. Thus, one way to look at market strength is to judge the slope of the RSI line. If the RSI slope is steep, it means market momentum is robust.
Wilder also stipulated that the RSI can indicate market tops and bottoms. So that this happens when the price reaches overbought/oversold conditions. Since its inception, the RSI threshold for overbought is 70 and for oversold is 30. On the other hand, if RSI hovers around the 50 level, the underlying market is considered neutral or no trend. Thus, while the market is looking for direction, it stalls for a while around the 50 level.
Why is it useful for traders?
Unknown to many, the RSI indicator works better as a momentum indicator than as a leading. However, RSI is a leading indicator because it can predict trend reversals whenever it gives an overbought /oversold reading or when it shows a divergence signal.
Traders know that momentum precedes price. So every time RSI becomes overbought/oversold, so the underlying market is overvalued/undervalued, traders expect a reversal to occur anytime soon.
However, you cannot tell with great precision when the reverse might come. The market can stay overbought or oversold for a while before a reversal comes about.
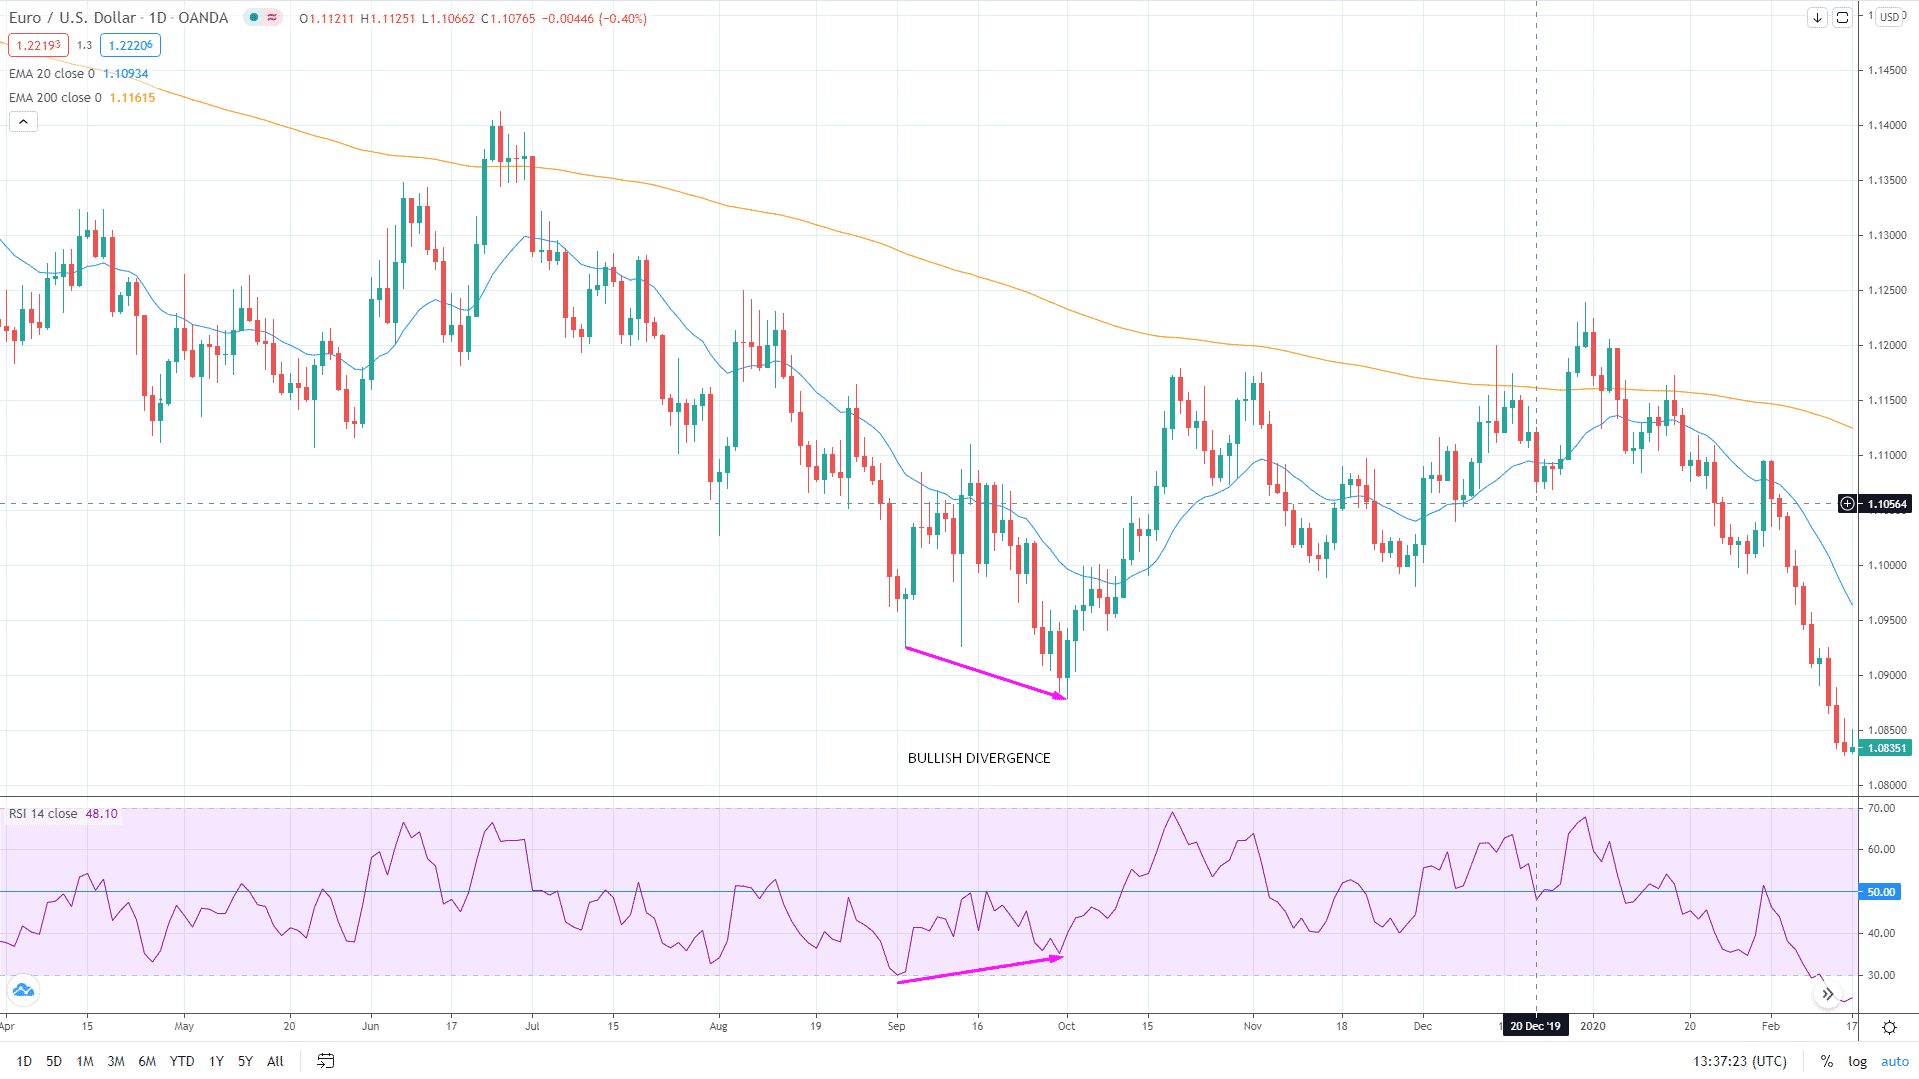
Meanwhile, a divergence can give traders quick profits when the market reverses or makes a substantial correction. See sample divergence setup above. The challenge in divergence trading is the placement of the trade stop loss. Although not using a stop loss can work at times, especially when the market eventually makes a trend reversal, the risk it poses is too significant to ignore.
What if the trend is robust that it ignores divergence completely? You are bound to experience large drawdowns if you do not use a protective stop loss.
How to use RSI successfully in trading?
The answer to this, as already mentioned, is to use RSI as a momentum indicator. You do not need to adjust any settings. The default RSI settings will work just fine. What you need to do is add another level, that is, the 50 level:
- When RSI is above 50, consider the market momentum bullish.
- When RSI is below 50, think of market momentum as bearish.
Look at the blue horizontal line in the RSI sub-window in the image above.
The next thing to do is take trades only in the direction of the market momentum. Then, open one or two charts and scroll to the left to see how the RSI performs as a momentum indicator. Again, you will see how effective this strategy is. To score high-probability trade entries, of course, you need to gather other technical tools to complete the RSI.
Basic strategies using RSI
The trader can use the RSI to trade market reversals on two scenarios:
- The first one involves a divergence.
- The second one concerns an overbought/oversold condition.
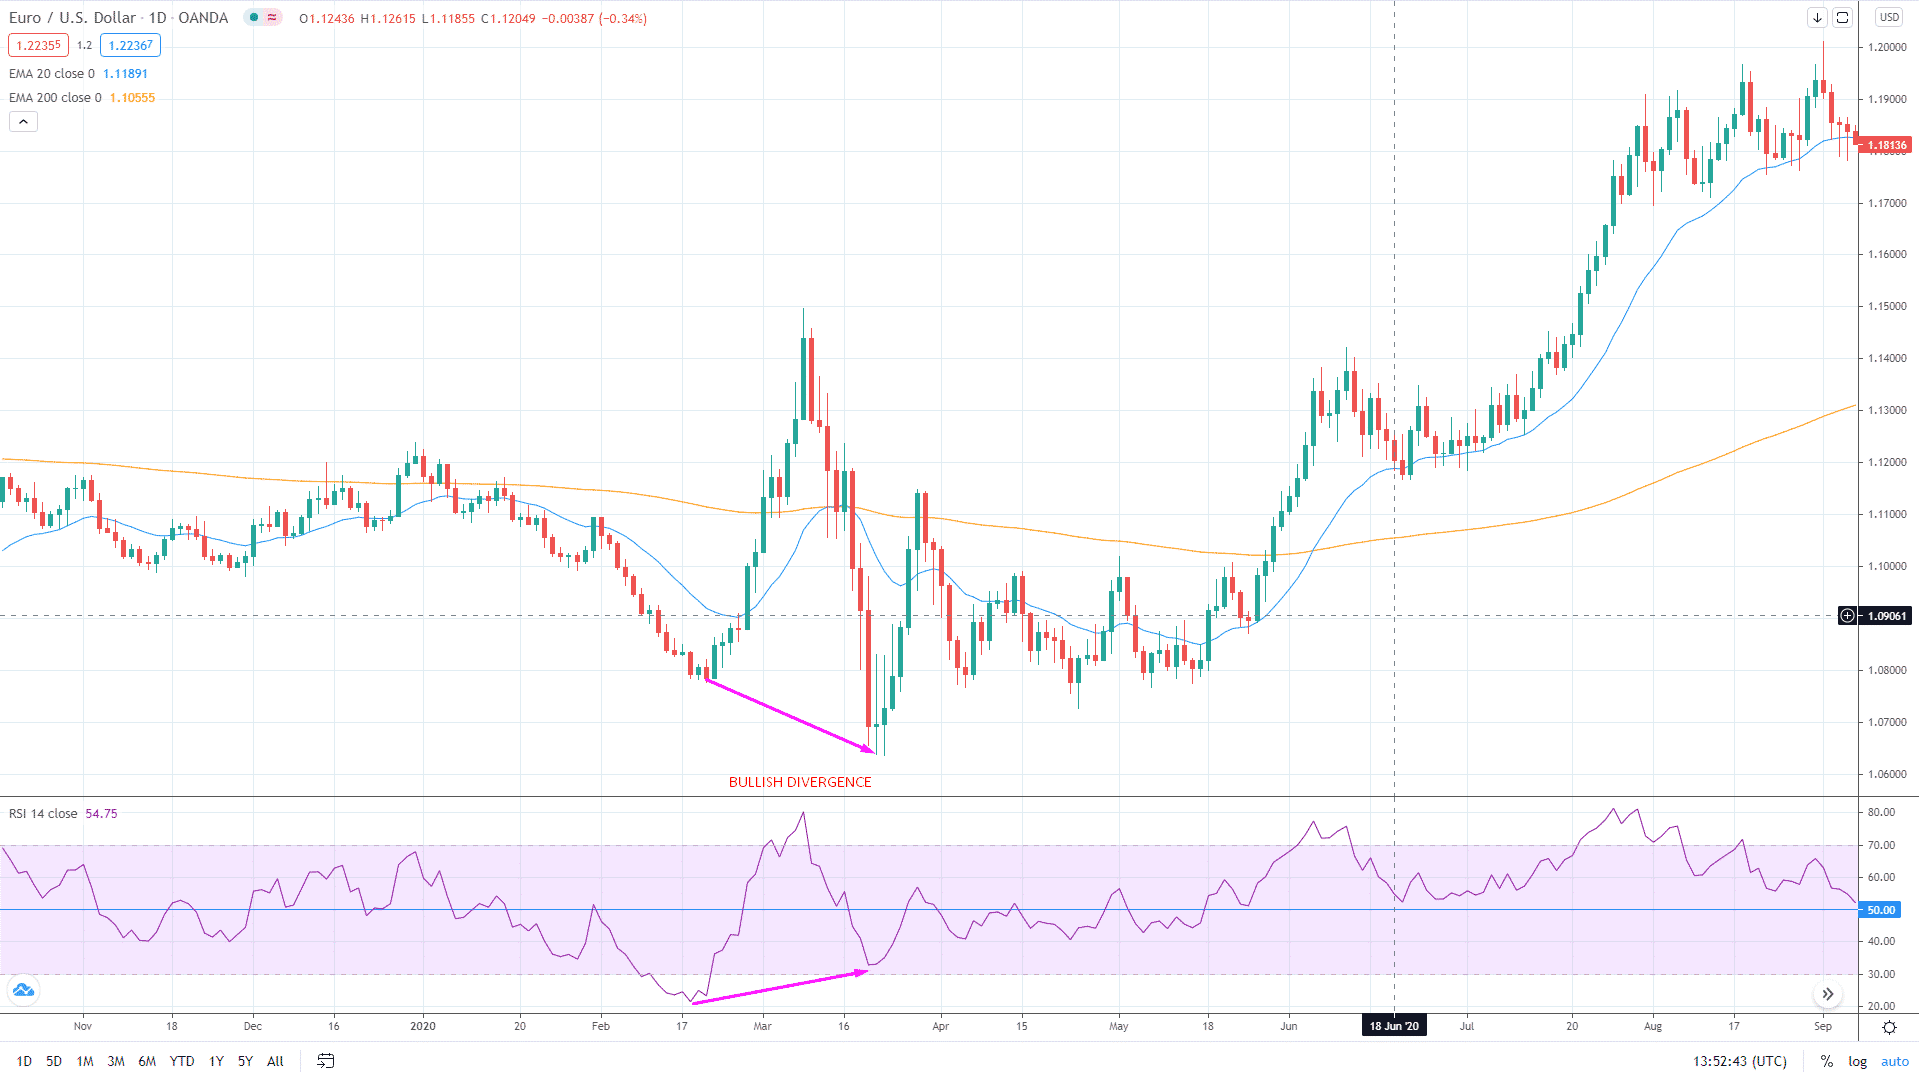
In the chart above, you can see that price made a lower low while the RSI created a higher low. This is a classic example of bullish divergence.
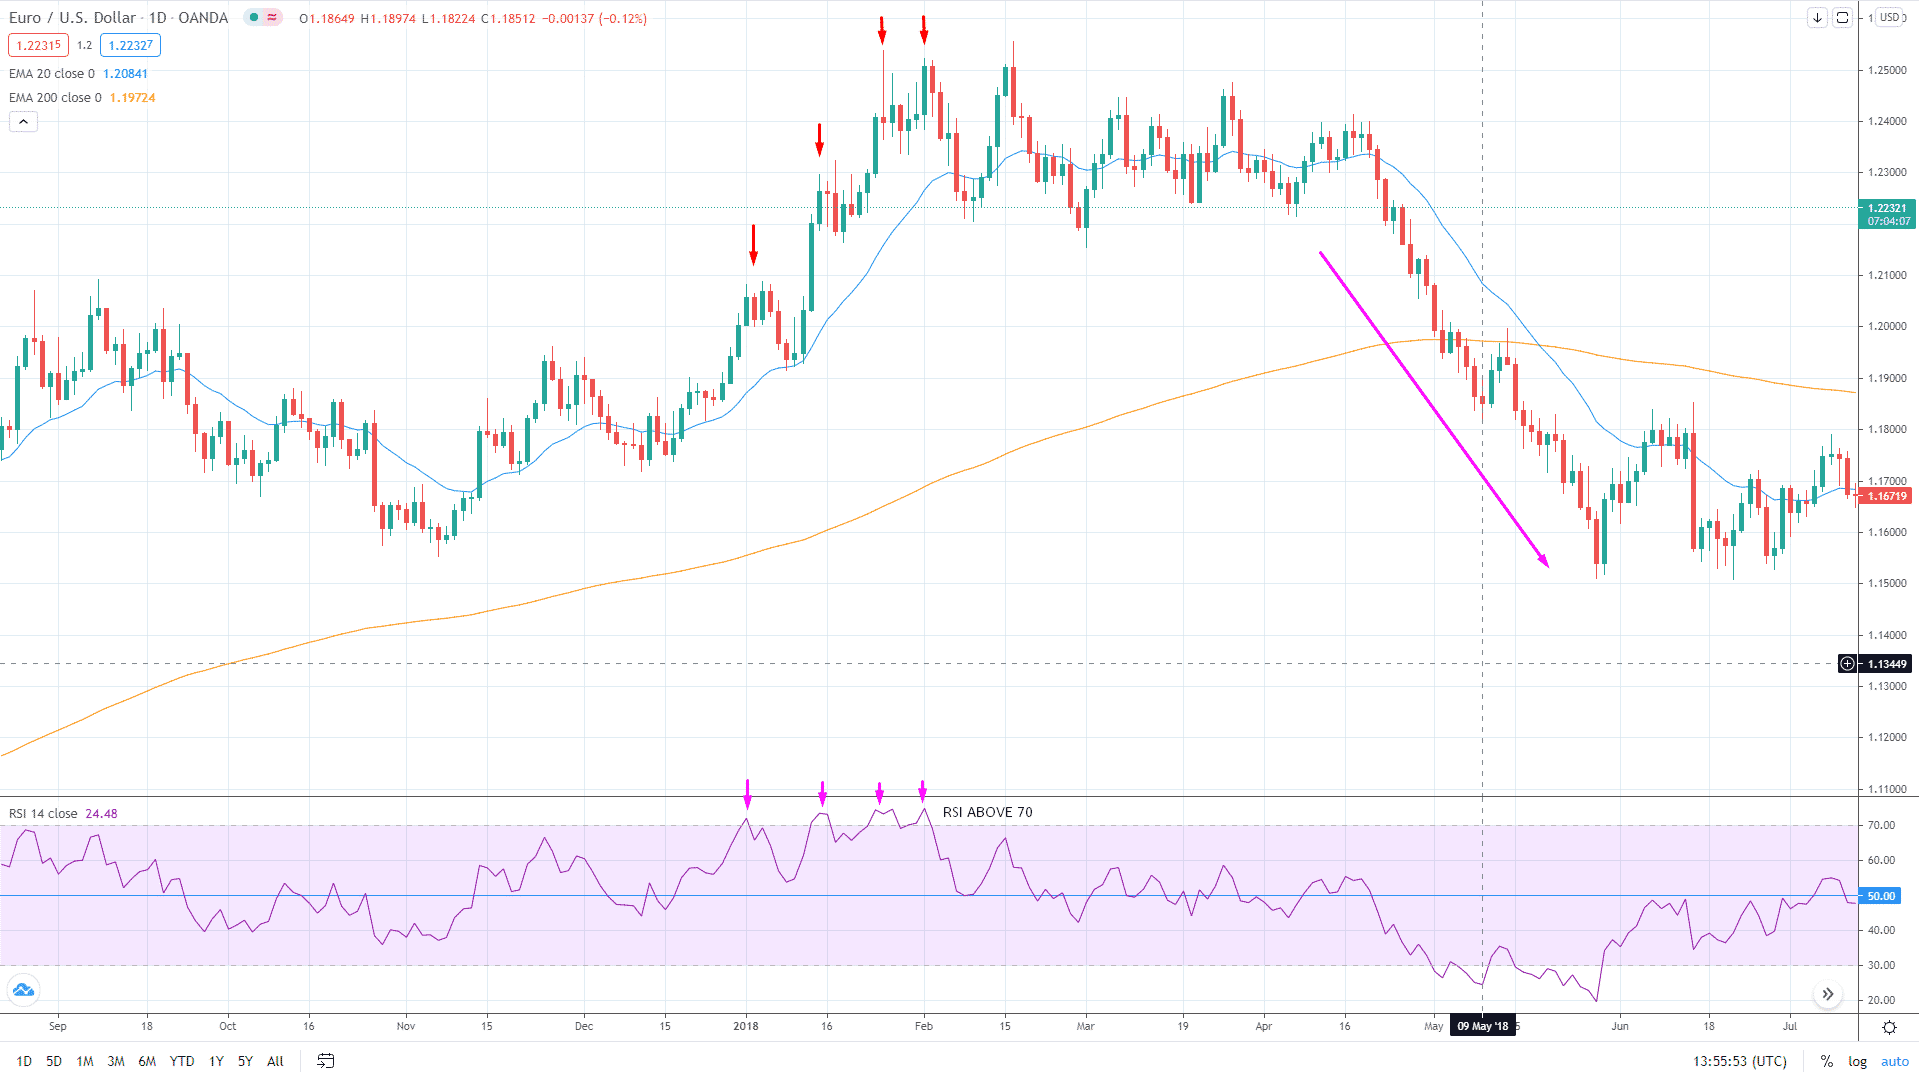
You can see that price went overbought at four points before it made the strong reversal to the downside in the above example.
The main focus of this article is to present to you a lesser-known strategy involving the RSI. In this strategy, you will need a clean chart and a few tools.
This trading system uses the following technical tools:
- 200 exponential moving average
- 20 exponential moving average
- Relative strength index
- A bullish or bearish candlestick
To use this system effectively, make sure that you follow the steps outlined below:
- Identify the trend using the 200 EMA.
- Look for a trend continuation setup using a breakout candle and 20 EMA.
- Check RSI momentum for confirmation.
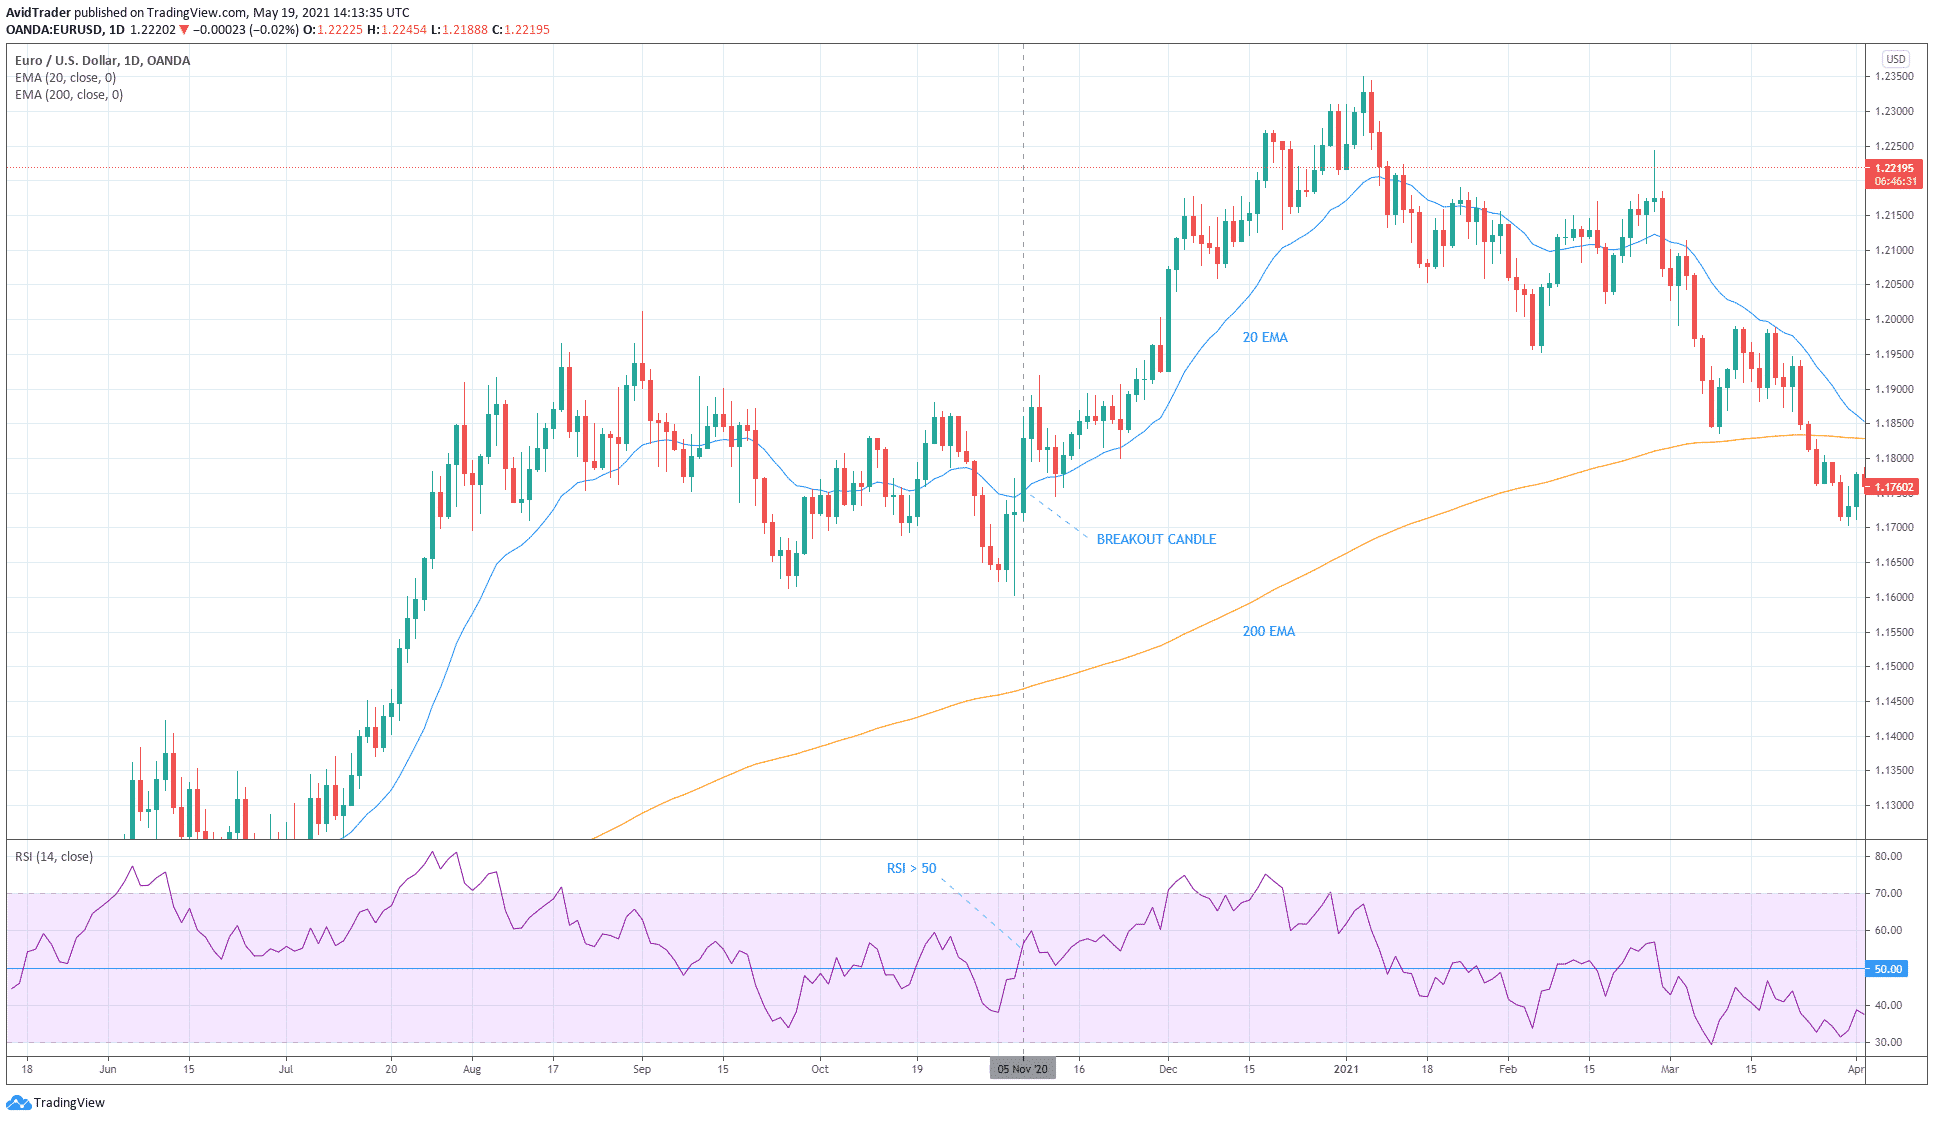
Buy trade: signal for entry
The first example is a buy trade at the daily chart of EUR/USD. Since the price is above the 200 EMA, the current trend is up, and we will be interested in buying trades. A buying opportunity occurred on 5 November 2020 when a bullish candle broke and closed above the 20 EMA. This is the signal for entry.
The last step involves checking if RSI momentum aligns with the setup. Since RSI is greater than 50 when the layout is formed, the buy entry is confirmed.
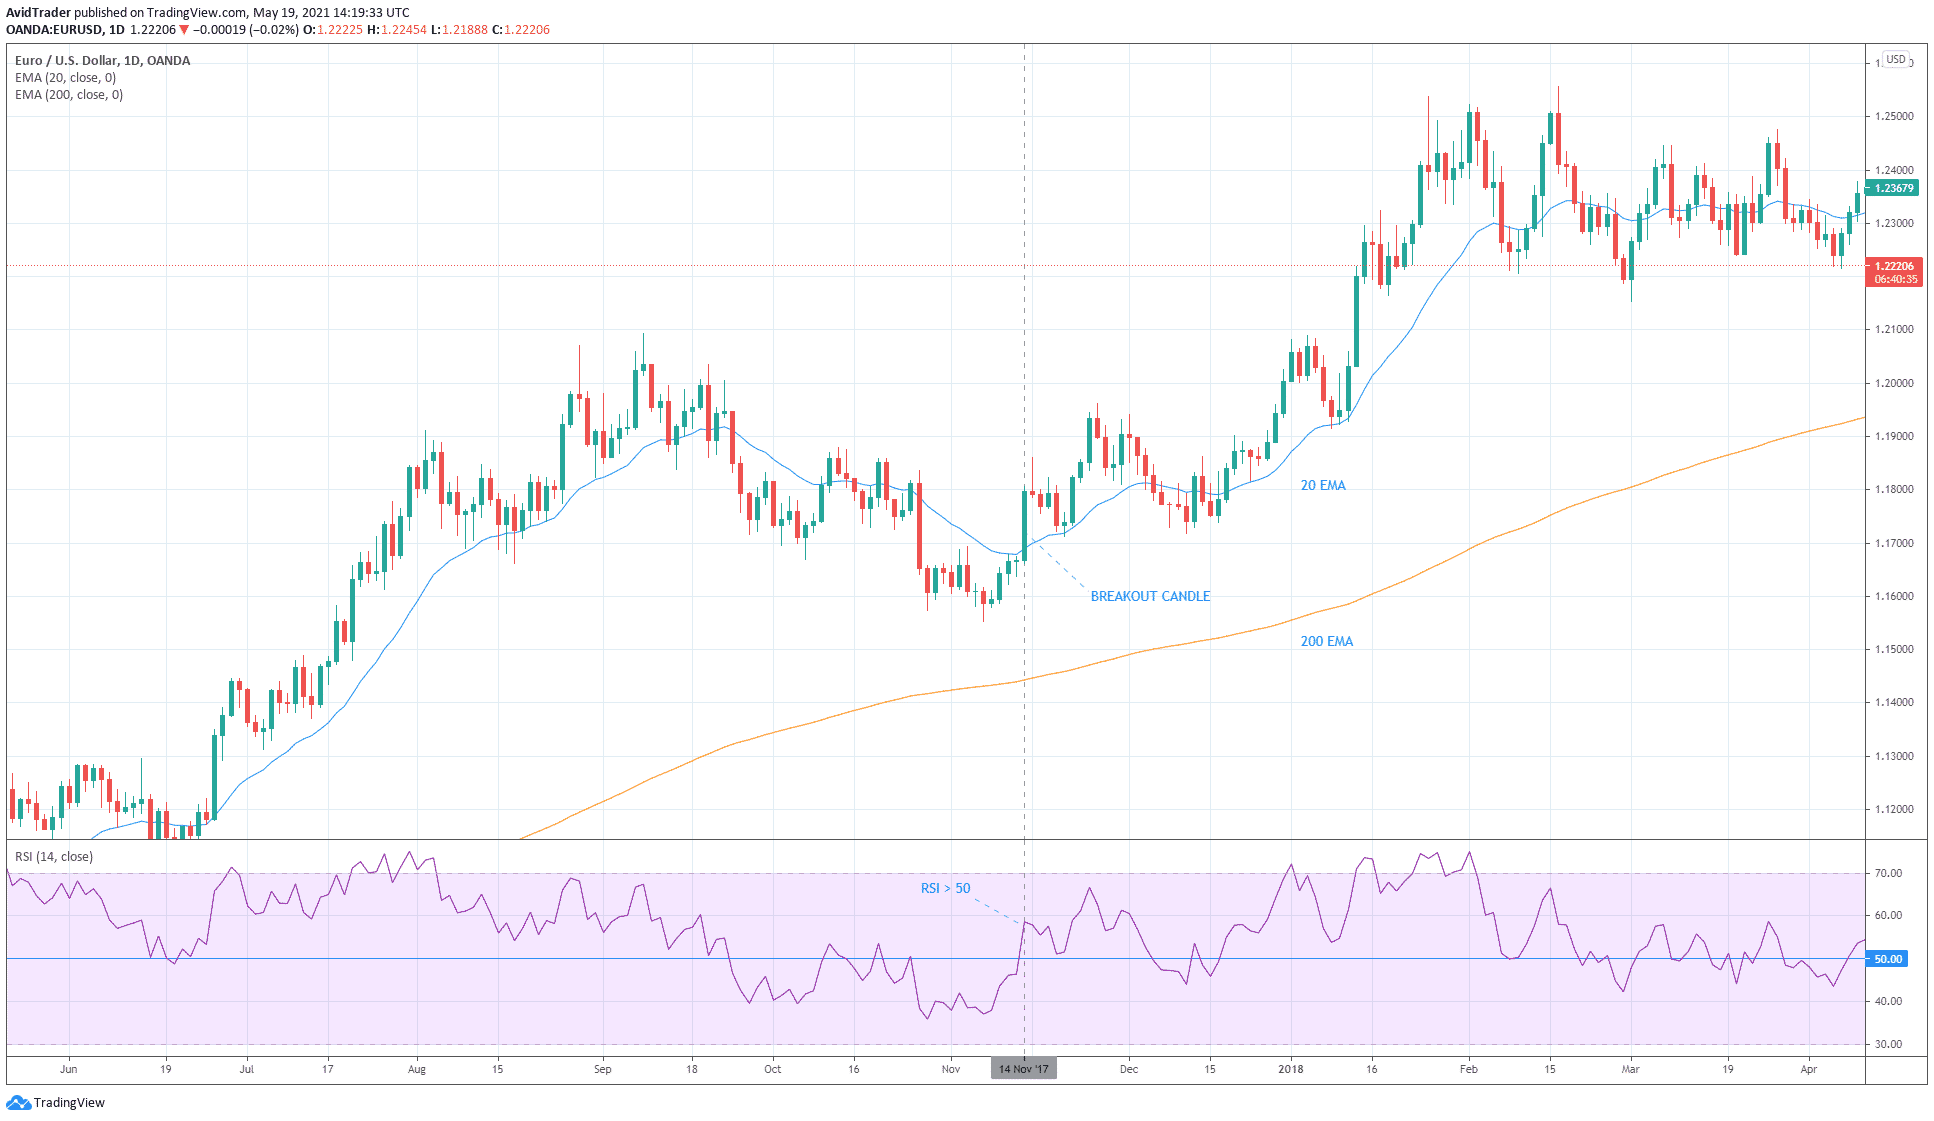
Another buy trade is depicted in the above image. Price is above 200 EMA, so the trend is up. A buy setup formed on 14 November 2017 when the price broke and closed above 20 EMA. Since RSI is greater than 50, the buy signal is confirmed.
Sell trade: signal for entry
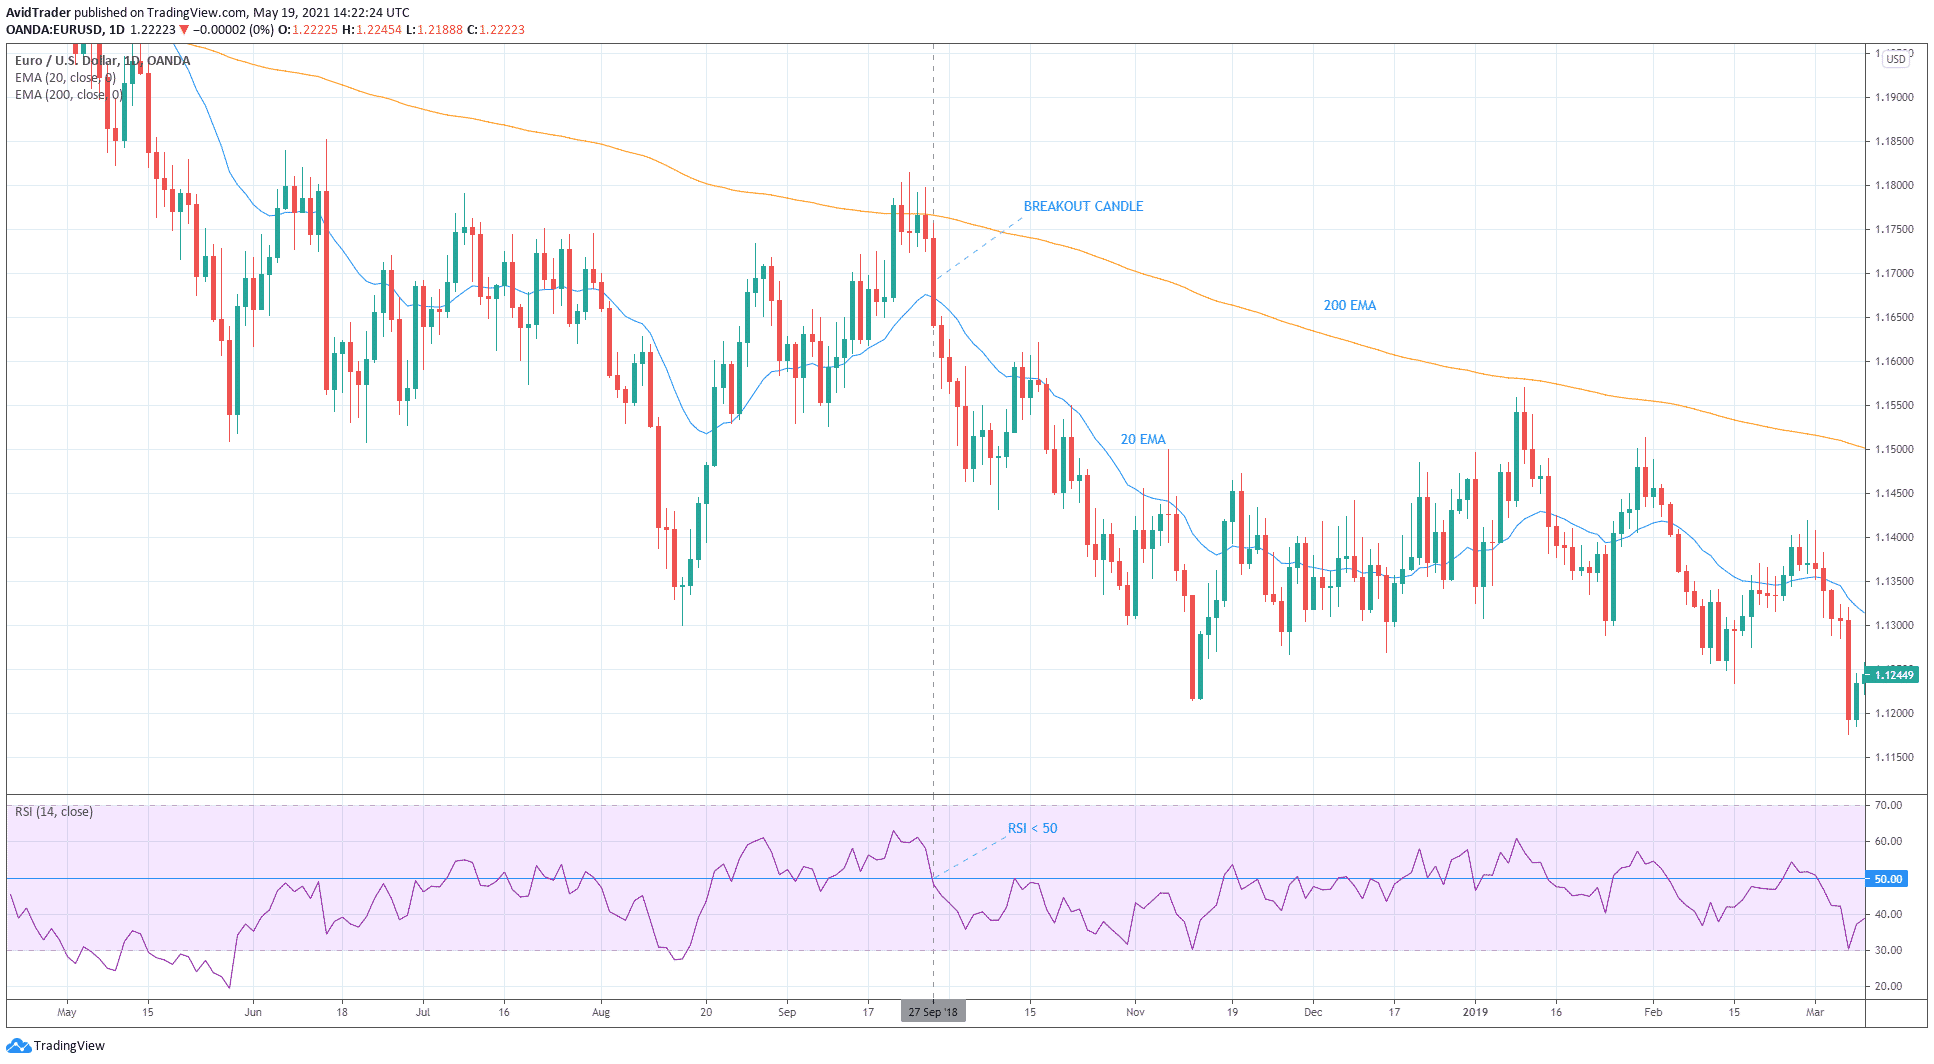
Now let’s look at an example of a sell entry. Since the price is generally below 200 EMA, the trend is down. A sell setup formed on 27 September 2018 when the price broke and closed below 20 EMA. Since RSI is below 50 when the setup is formed, the sell entry is confirmed.
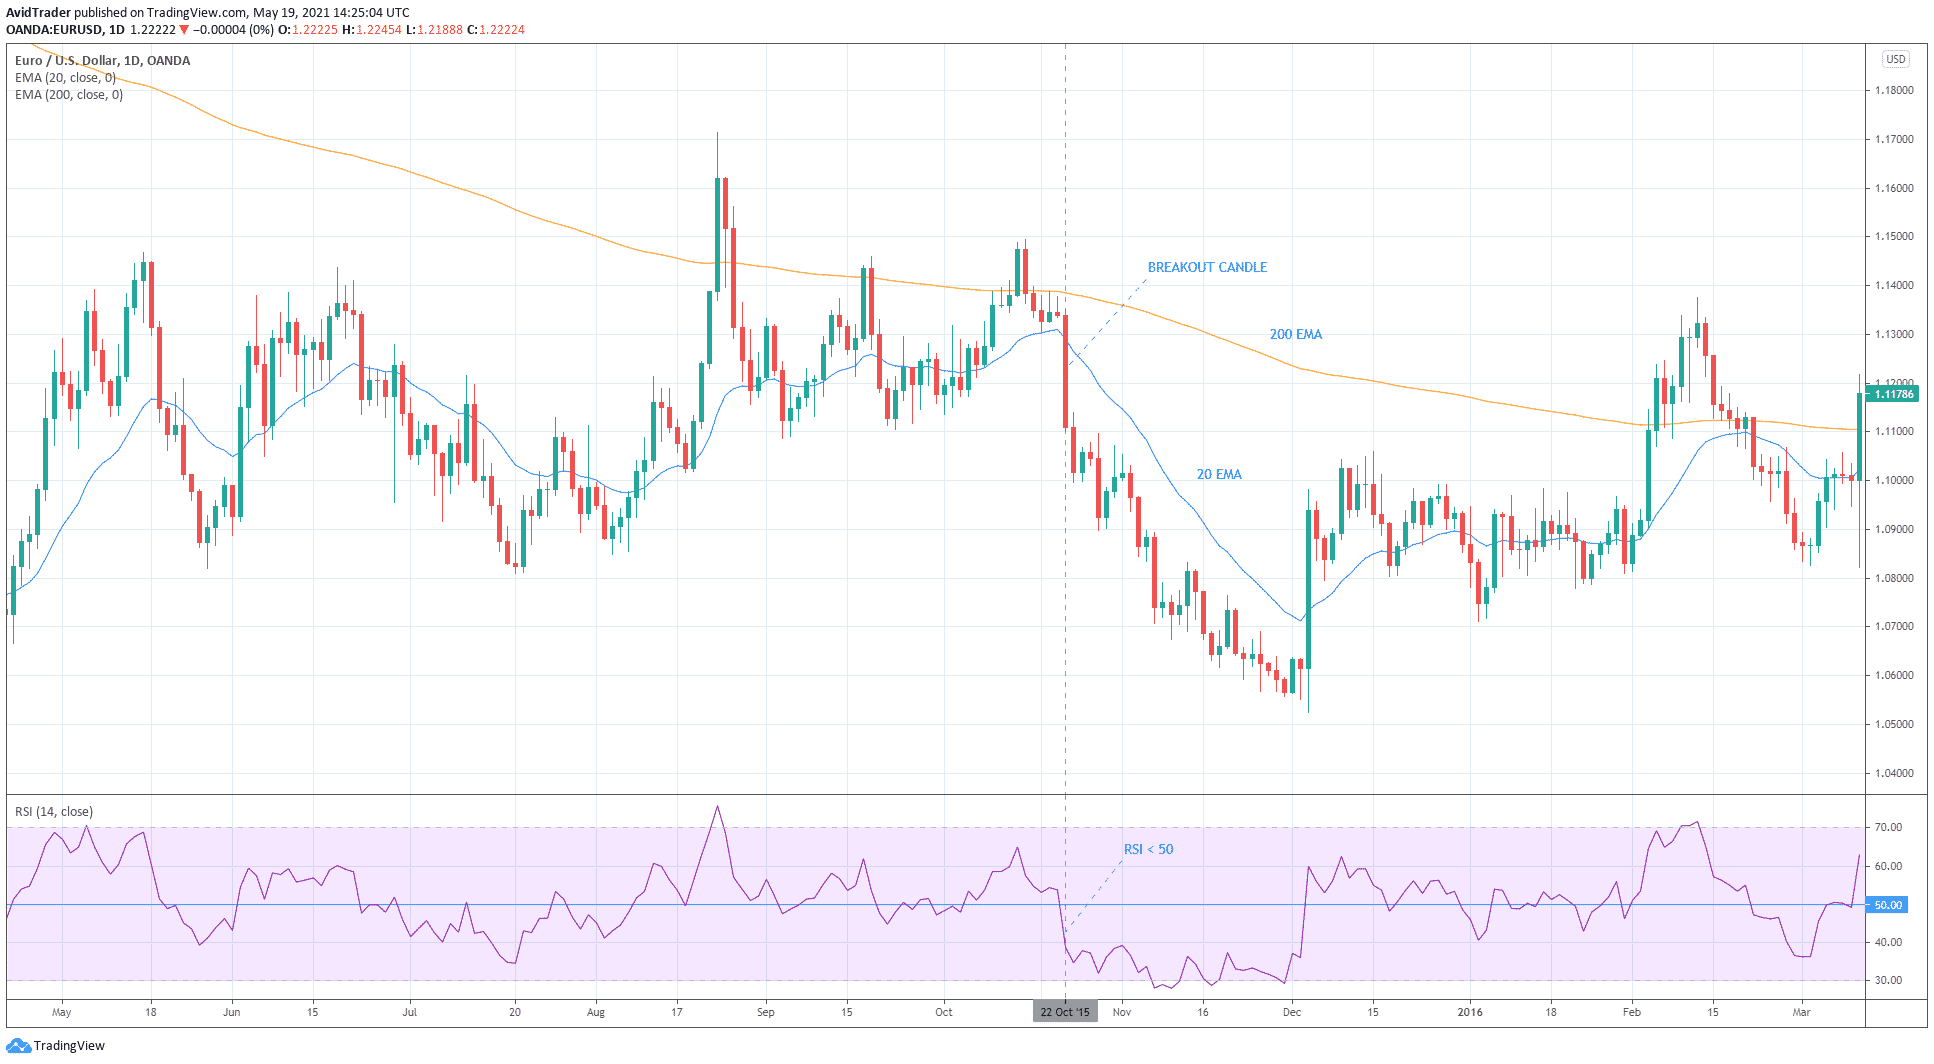
The last example is also a sell trade. The trend was generally down when the setup formed since the price was below 200 EMA. On 22 October 2015, the price broke and closed below 20 EMA, while RSI fell below 50. As a result, the system generated and confirmed a sell signal.
Final thoughts
As you can see, you can make money trading with the RSI if you use it as a momentum indicator. In this way, you are trading with market momentum at your back. This method dramatically differs from the conventional trading divergence and overbought/oversold condition, often countering the trend. However, the old market truth about trading with the trend still holds value.
