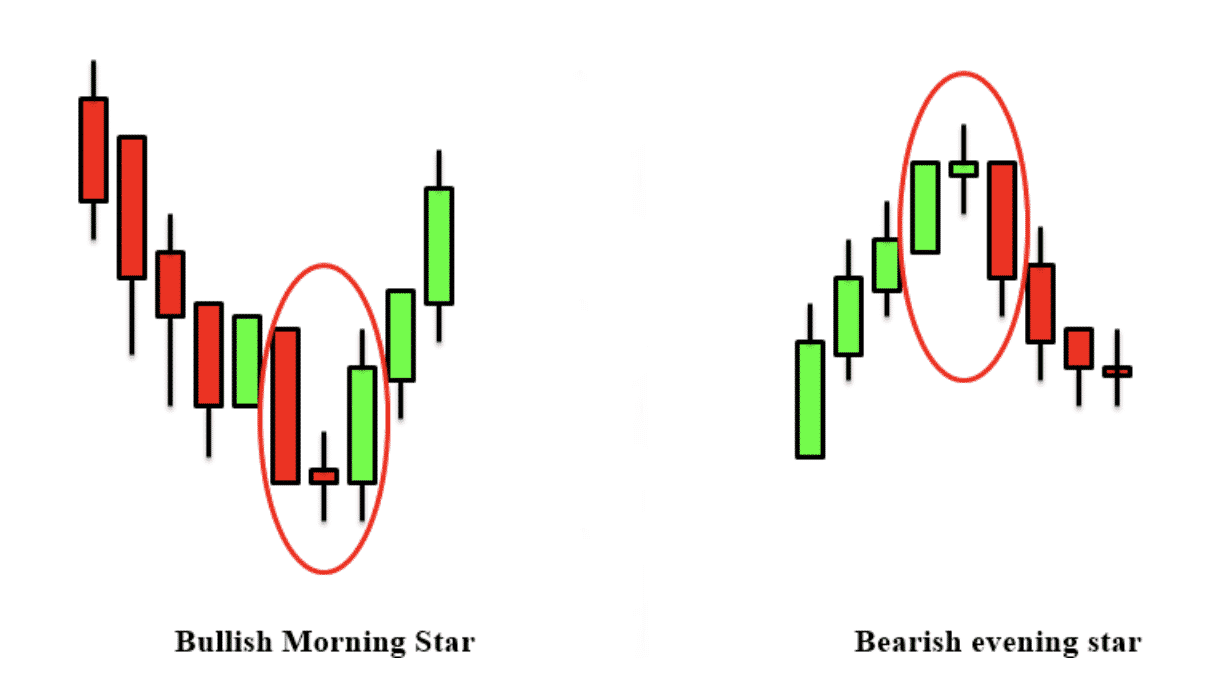
Small candles with a higher price than the previous candles are known as “stars.” Candles with little bodies in the star position indicate market uncertainty and the potential for the present trend to reverse. If the first candle is huge, this arrangement has a better chance of reversing the trend than if the first candle is smaller.
Continue reading this post to learn more about Morning and Evening star candlestick patterns, their significance, and how to trade with them, as well as to check some technical charts reference.
Morning star vs. Evening stars
Candlestick patterns are known as “Morning stars,” are seen as signs that the market is on the right track by technical analysts. That is why they are considered bullish. The appearance of Morning stars following a negative trend is an excellent indicator. This is a sign that prices will be adjusted shortly. Investors employ indicators like the Morning star to assess if the market is about to turn around.
The Evening star is a stark contrast to the Morning star. Candles of varying lengths follow a long white one. One of the smaller candles should be at least half as long as the first white candle used in the prior session, at the very least. It is projected that the bears will overcome the bulls, signifying a reversal in an uptrend. A spinning top must have two candlesticks far apart to be a star.
Morning star pattern
Traders use three consecutive candlestick patterns known as a “Morning star” to depict a bullish technical analysis signal. After a downward trend, the Morning star is the first sign of an upswing. This suggests a change in the pricing trend. To confirm a trend change, investors watch for the arrival of a Morning star and then look for further indicators for confirmation.
A Morning star consists of a tall black candlestick, a shorter black or white candlestick with a long wick, and a third tall white candlestick. Market uncertainty is reflected in the Morning star’s middle candle, suggesting a move from bearish to bullish. Look for a third candle to appear to signal a new upswing.
Morning star patterns may be utilized as a visual signal for the beginning of a trend reversal from bearish to bullish. Still, they become more meaningful when other technical indicators, such as those mentioned previously, support them. Another critical factor is the volume that influences the pattern’s development.
Is it worth using?
Consider the following points for it:
- You can easily identify its pattern on the chart if you are an intermediate trader and even if you are a beginner trader.
- There is an excellent risk-reward ratio when we trade with these strategies.
- It is not recommended to trade this method alone but to use this pattern with other trading tools because, despite the formation of Morning star, there are chances that prices might go down further if the sellers are strong enough.
Using the Morning star candlestick pattern to trade
There are four factors to bear in mind when forming a Morning star.
- Using a Morning star is only possible when the market is in decline.
- The first candle should be a bearish one, preferably a long one.
- The second candle should be indecisive as the bulls and bears level out during the session.
- The 3rd candle must be a strong bullish one to confirm the change of direction.
As previously stated, Morning star formations are rarer than single candle formations, although they do occur. Furthermore, they are more difficult to detect since you must fulfill all four conditions before confirming their presence.
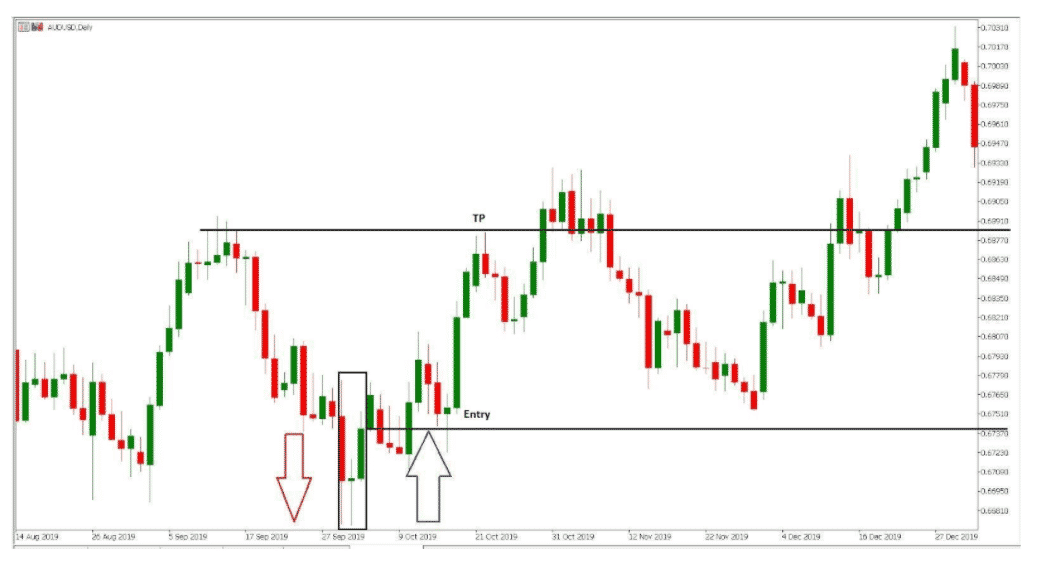
The AUD/USD daily chart is used in this example. A new short-term low was established as a result of the price fall. After a long bearish candle, a big downturn was clearly evident.
Doji candles are formed when buyers and sellers cannot agree on a close around the session low. Therefore the price rises and creates a Doji candle, indicating uncertainty. A long bullish candlestick on the next candle creates the Morning star pattern. Now that we have this degree of assurance, the bullish reversal is almost guaranteed to commence.
Bullish trade setup
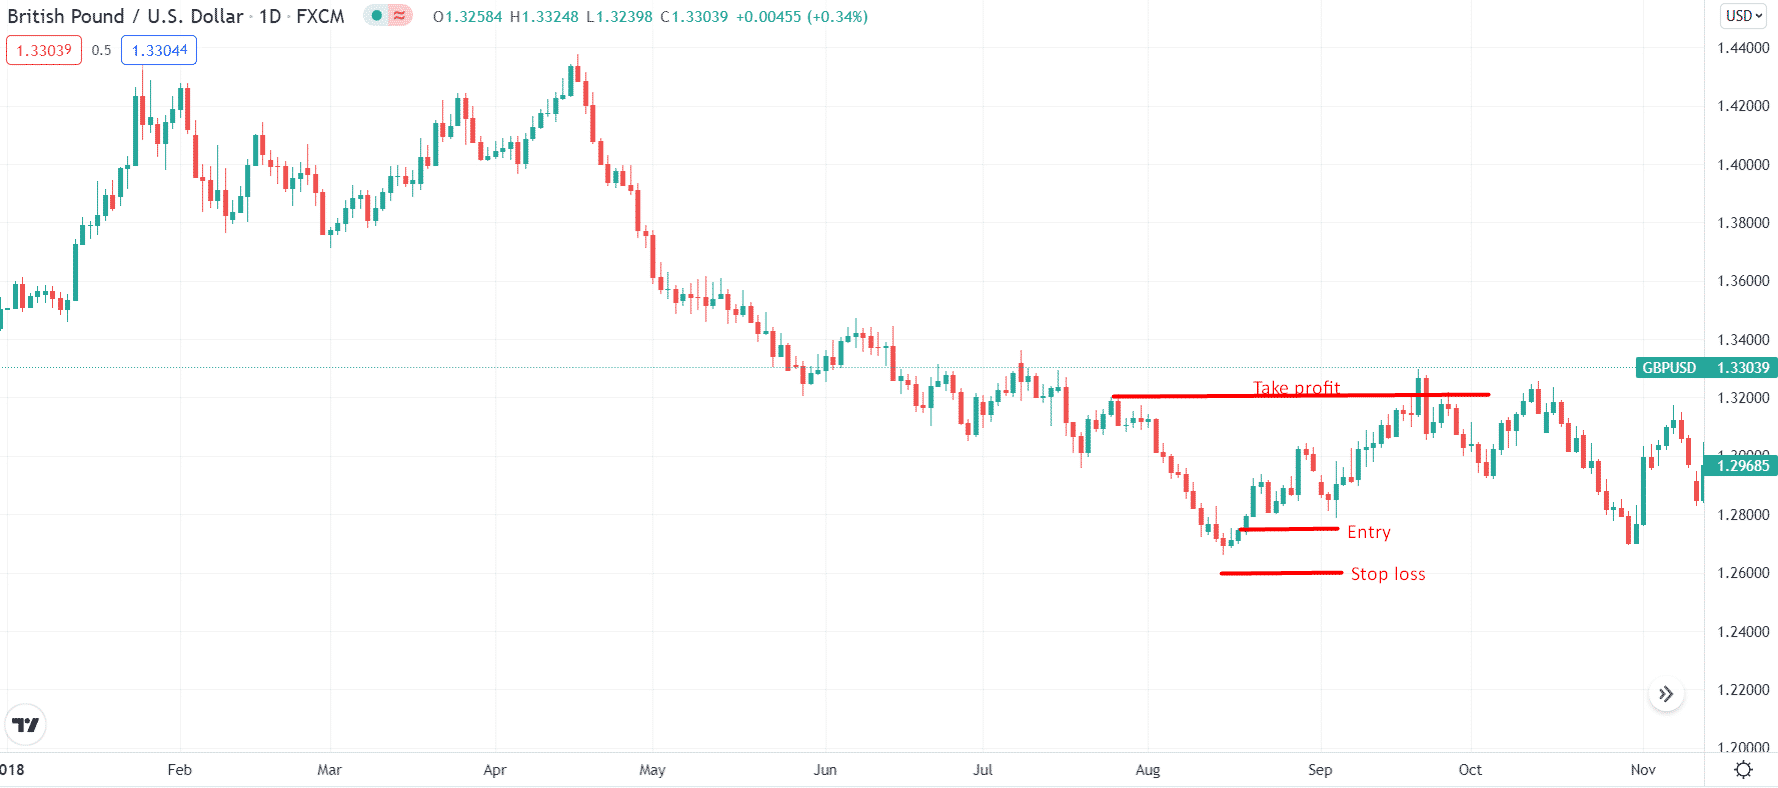
To find out how to trade its bull market, we must look into a real example displaying this technique. So let’s look into a daily bar graph of GBP/JPY to understand the structure and how to trade it.
Best time frame to use
The optimal time frame to trade this sort of setup is a daily chart for swing traders and a 15-minute for the intraday traders.
Entry
Once you see a Morning star candle on the daily chart (after closure), set a buy stop order a few pips above the high of the Morning star. Let the market complete your order on the same day or the following day.
Stop loss
The stop loss should be positioned somewhat below the low of the Morning star candle. For careful purchasers, the stop loss might be near local lows.
Take profit
You can position the take profit limit around the latest swing high, or you may also choose any immediate horizontal level. Then, calculate the distance between your stop loss and your entry point and keep your take profit level twice that distance.
Evening star pattern
Traders use Evening stars to determine whether a trend will reverse direction. This bearish candlestick pattern consists of a larger white candlestick than the other two, a smaller-bodied candle, and a red one.
When an uptrend reaches its peak, Evening star patterns might be visible, suggesting that the upswing is reaching its conclusion. On the other hand, it is considered a good sign if the Morning star pattern is seen, in contrast to the Evening star.
Is it worth using?
Consider the following considerations while making your decision:
- Forex traders have difficulties forming judgments only based upon the appearance of the Evening star candlestick pattern.
- The price may also continue to increase if the reversal fails.
- Despite this, the pattern has well-defined entrance and exit locations, which are easily recognizable.
- Trading the Evening star candlestick pattern
Using the Evening star candlestick pattern to trade
As a powerful indication of price declines, the Evening star pattern is one of the best indicators. Patterns begin to appear after three days.
- On the first day of trade, a massive white candle appears, which signals rising prices.
- The second day’s candles are smaller, indicating a moderate price increase.
- The huge red candle of the third day closes at the middle of the opening price of the first day after it opened lower than the previous day.
As you can see in this NIKE chart, the Evening star pattern has formed, which signifies an end to the uptrend that preceded it. After the formation is completed on the chart, traders may try to enter at the beginning of the following candle. More cautious traders should wait to enter the market until they notice if the price action has changed or not. However, in fast-moving markets, the trader may be able to get in at a lower price.
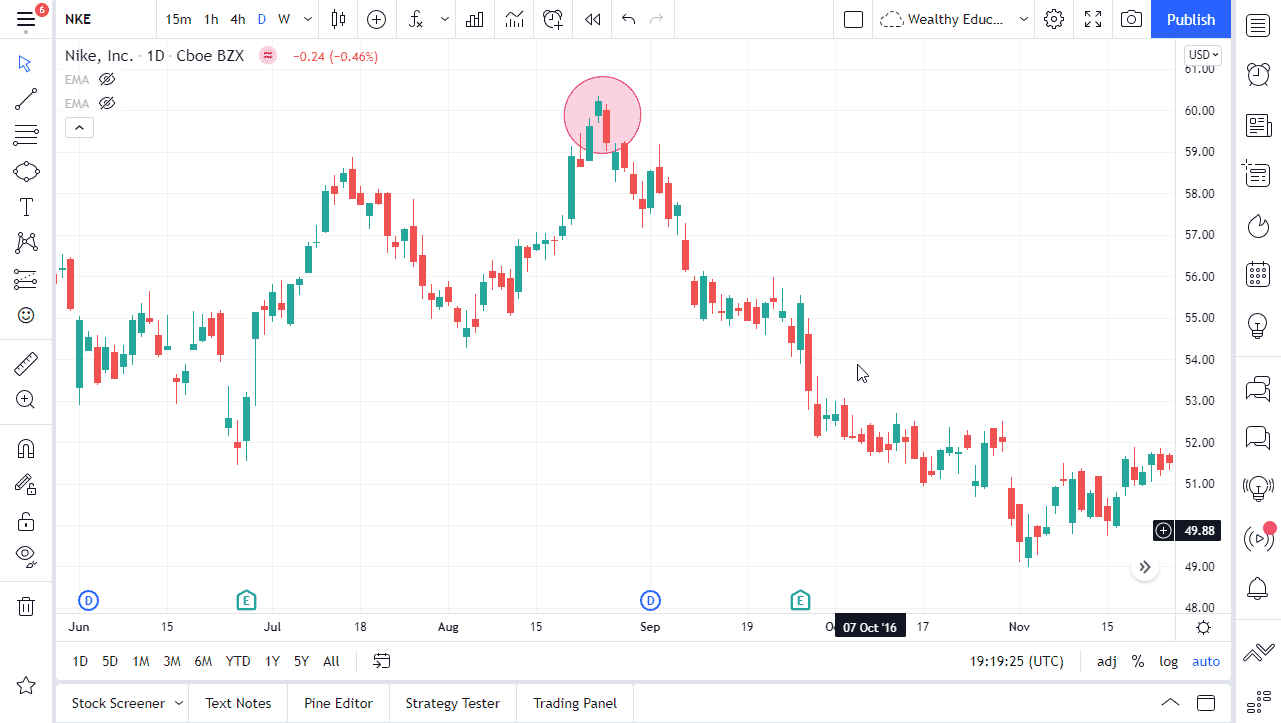
As a starting point, previous levels of support or consolidation points might be used as benchmarks. A reversal can be verified by placing stop orders above the current swing high, as long as this level is not violated. Risk management and a positive risk-to-reward ratio are vital since there are no guarantees in the foreign exchange market. The three-candle pattern usually begins at the previous closing level on forex markets since the price rarely gaps as it does with stocks.
Bearish trade setup
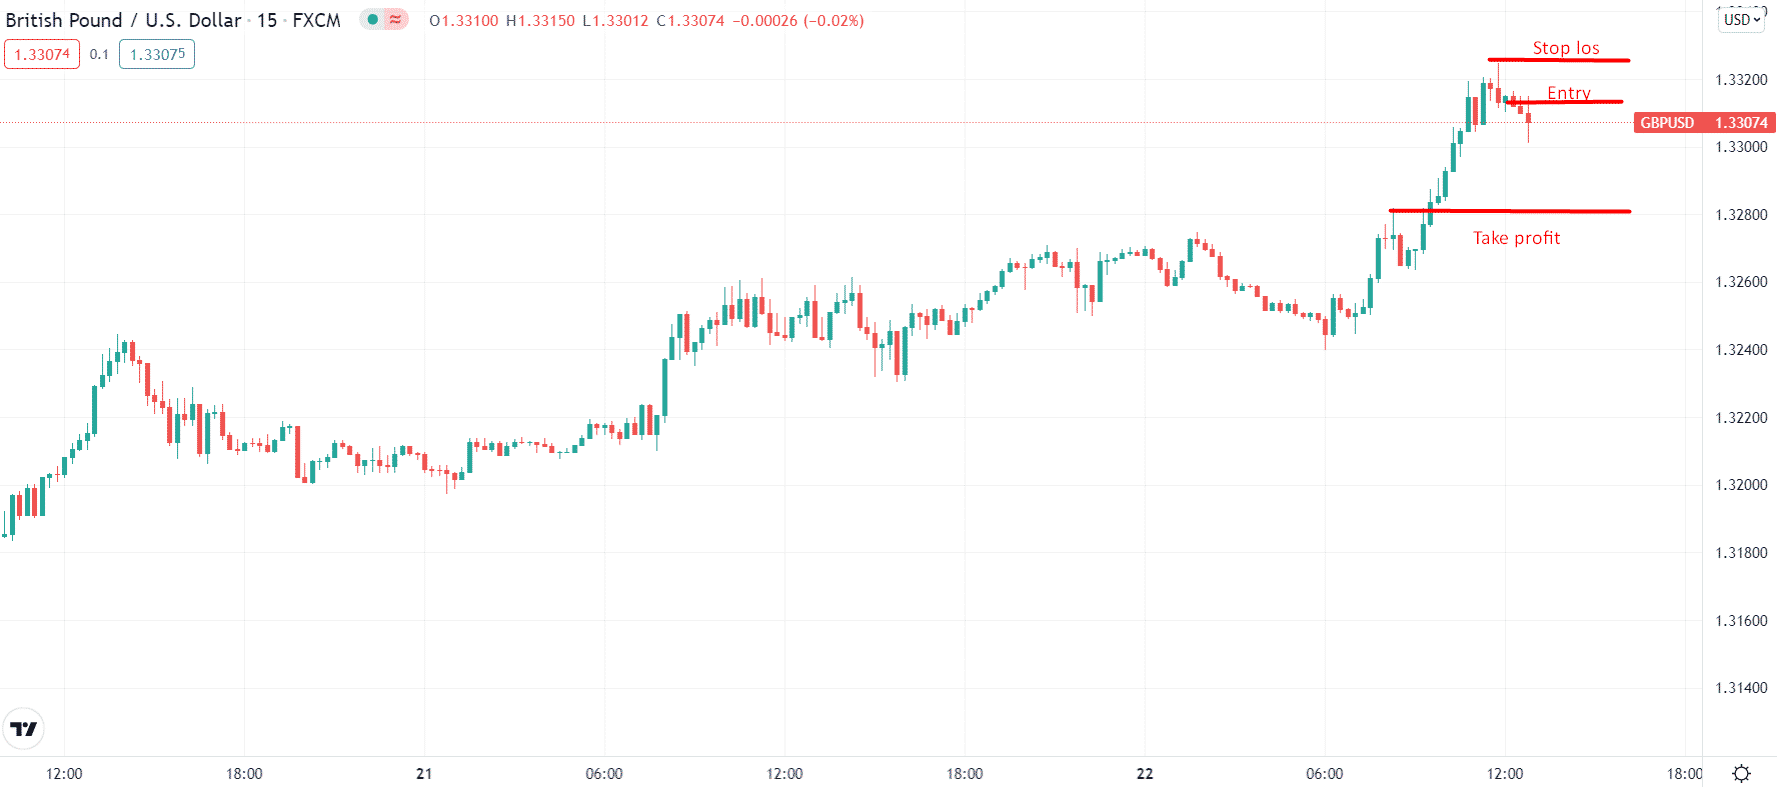
To find out how to trade its bear market, we must look into a real example displaying this technique. So let’s look into a daily bar graph of GBP/JPY to understand the structure and how to trade it.
Best time frame to use
The 15-minute candlestick chart is a popular time frame for this. Many traders prefer it because it’s neither too quick nor too slow.
Entry
After the formation is completed on the chart, traders may try to enter at the beginning of the following candle. However, more cautious traders should wait to enter the market until they notice if the price action has changed or not.
Stop loss
A stop-loss might be put above this level if the current swing high has not been breached.
Take profit
You may use a fixed TP at a 1:2 risk to reward ratio, or you may choose a strong support level for this.
Final thoughts
Star patterns are popular because of their simplicity and common occurrence on the charts. Moreover, the probability of success is also high. However, like any other trading method, this method also comes with some failure ratio.


