“What is the best technique to trade forex and crypto?” — one of the frequently asked questions by new investors. Following in the footsteps of some of history’s greatest successful investors, like Warren Buffett and Ralph Seger, demonstrates that embracing a fundamental procedure has advantages.
- What about the millionaires who profited from the technical analysis?
- What about the reality that, according to CNBC, machines control around 80% of stock buys and sells in today’s technology-driven society?
- Isn’t it true that the masses can’t be wrong?
Both technical and fundamental analyses have their place in reality. Which option is ideal for you is determined by your objectives and risk tolerance.
What is technical analysis?
It is the practice of analyzing FX and crypto assets using statistics. Analysts and investors trace trends in securities movements using data on market activities, including historical prices and trade volume.
The framework in which traders evaluate price movement is known as technical analysis. According to the notion, a person can determine current trading conditions and prospective price movements. The most persuasive reason for using such analysis is that all existing market news is potentially factored into the price.
Technical traders often believe that “it’s all in the charts!” We guess you’ve heard the phrase “history tends to repeat itself?” After all, that is the heart of technical analysis.
In technical analysis, the market participants keep an eye on a price that has previously functioned as a major resistance or a support mark. Moreover, they watch for patterns that have already formed and develop trading ideas based on the assumption that prices will behave similarly. Moreover, it’s more about probability than it is about prediction.
It is a study of historical price activity to detect trends and divine price movement in the future.
Best trading strategies based on technical analysis
In the FX, traders with technical skills analyze price charts to predict price movement. The two most essential elements in this analysis are the time frames being examined and the technical indicators that traders use.
Time frames in the technical analysis
They can vary from one minute to weekly and from weekly, monthly, or even yearly periods. The following are some of the most common time frames.
- 5-minute chart
- 15-minute chart
- Hourly chart
- 4-hour chart
- Daily chart
Moving averages
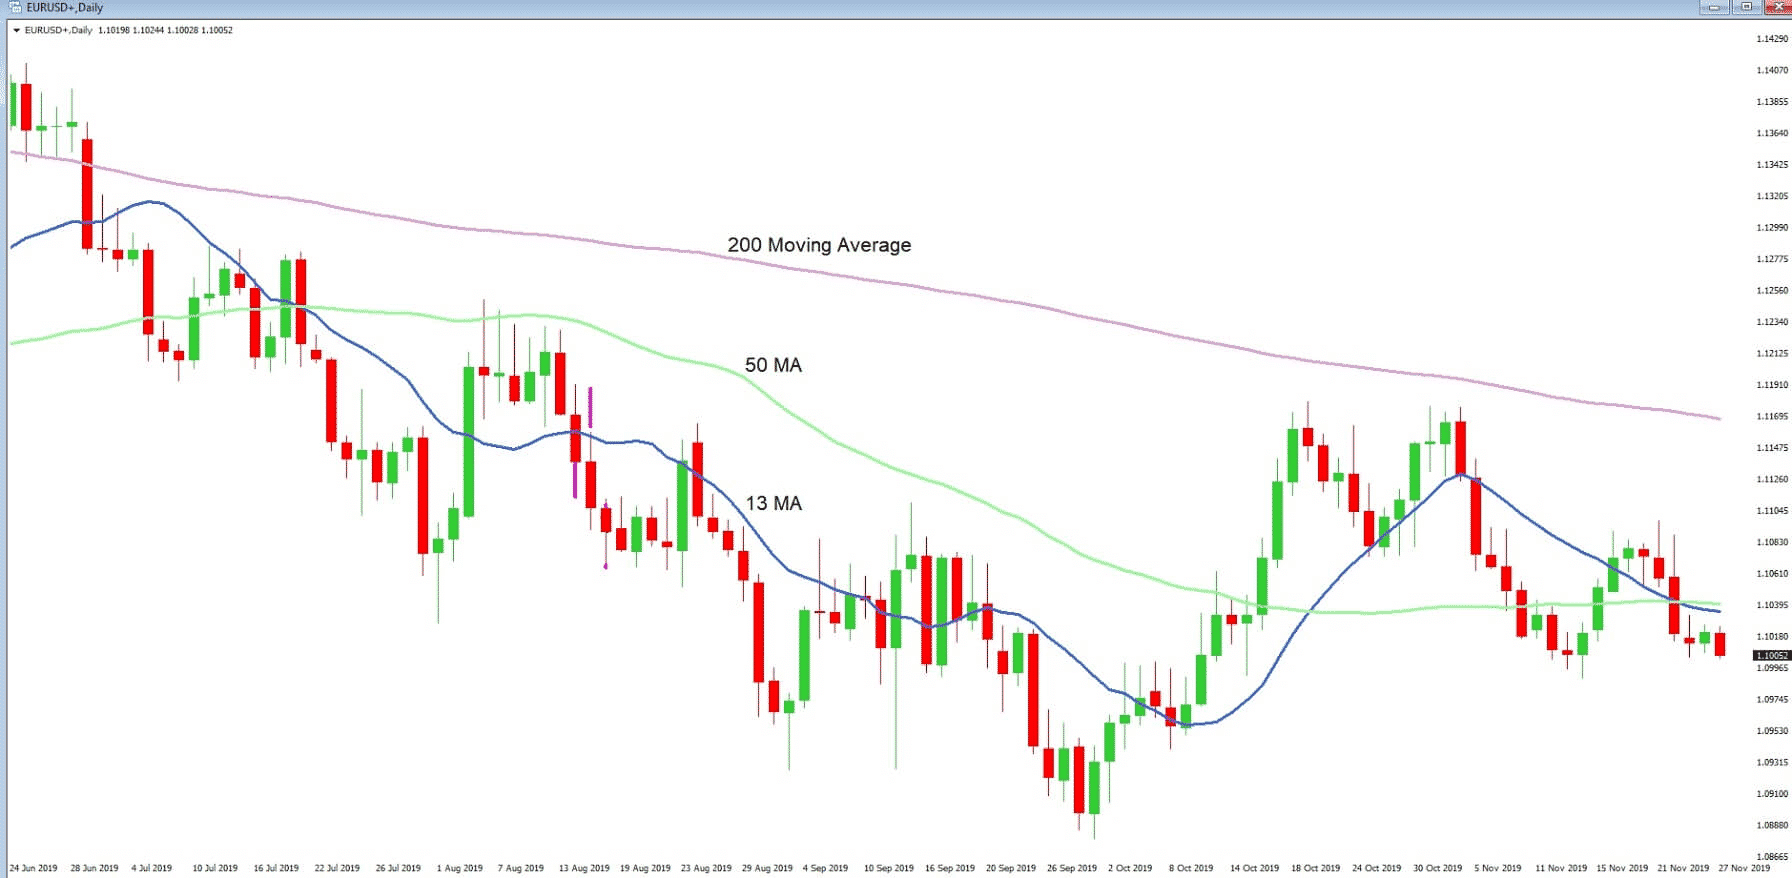
Technical analysts can implement an essentially limitless number of technical indicators to help them make trading decisions. Moving averages (MA) are arguably the most widespread technical tool. A couple of MAs are used in many forex trading methods.
- Buy until the price continues to hold above the 50-day MA.
- Sell until it remains below the 50 MA.
It is a simple MA forex trading strategy.
The higher the MA figure, the more substantial price change is deemed concerning it. Price passing over or beneath a 100- or 200-day MA, for example, is typically regarded as far more vital than price crossing over or beneath a 5-day SMA.
Another commonly used technical indicator is MA crossovers. When the 10-period MA crosses over the 50-period MA, a crossover trading strategy might be to purchase.
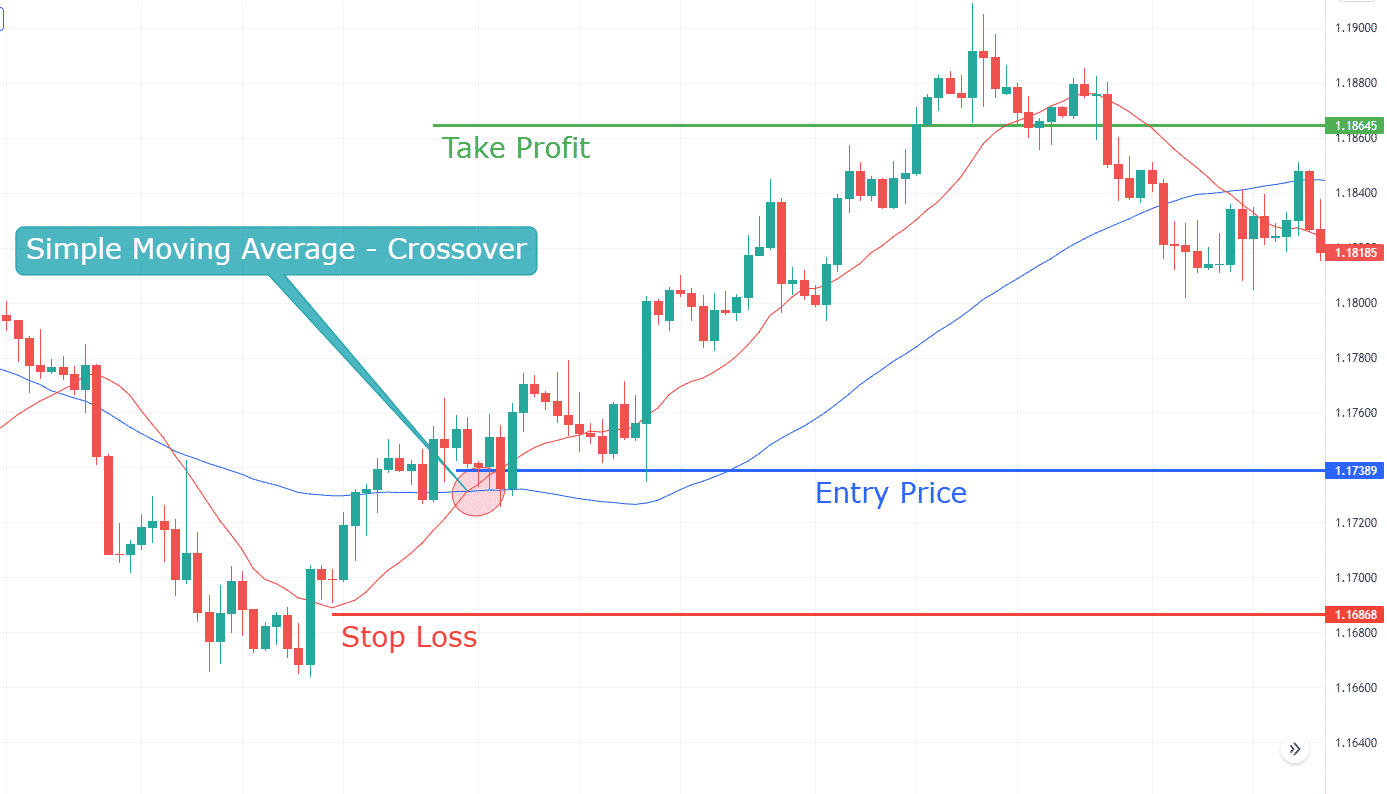
For example, on the 4-hour chart above, the EUR/USD price has crossed over the 15-day and 50-day simple moving averages. Technically, the closing of a candle above the moving average suggests a bullish bias in the market.
SMA crossover
However, the most important factor to consider here is a simple MA crossover. As we can see, the 15 SMA (red line) has crossed over the 50 SMA (blue line), demonstrating bulls are taking control.
Entry price
As per the SMA strategy rules, we need to wait for the closing of a couple of candles above the 15-day and 50-day SMA before placing a bullish trade. Hence, we entered the buy trade at the 1.1738 level.
Stop loss
The stop loss should be below the 15-day and 50-day SMA or below an immediate low. Therefore, we placed a stop loss below the 15 and 50 days SMA lines at the 1.1686 level.
Take profit
As per the SMA strategy, we can hold trades as long as the current market price of EUR/USD is above the 15-day and 50-day SMA. Therefore, we can leave the trade with an open stop loss. However, the trade should be closed as soon as the EUR/USD closes below the SMA lines. Therefore, we can take profit at the 1.1865 level.
What is fundamental analysis?

It is a primary technique for currency traders to investigate the roots of seemingly random exchange rate swings. The process of dissecting the impact of political, economic, and social factors on relative value is known as fundamental analysis. FX traders can make well-informed trading decisions by identifying the primary drivers of a currency’s inherent value.
In a nutshell, the fundamental analysis is as follows. Let’s imagine the dollar has been strengthening as the economy in the United States improves. As the economy improves, higher interest rates may be required to keep growth and inflation under control.
Dollar-denominated financial assets become more appealing when interest rates rise. Therefore, traders and investors jump into the market to purchase US dollars before its price starts growing. This raises the currency’s demand. As a result, the US dollar’s value will likely rise against foreign currencies with lower demand.
News trading strategy
When looking for long-term trading possibilities based on economic events, it is critical to consider historical and current data. Long-term trends are driven by fundamental events, various economic events released over a specific period. This is because news can take weeks or months to be digested by the market. We can utilize financial data to see the big picture and how it might affect the currency.
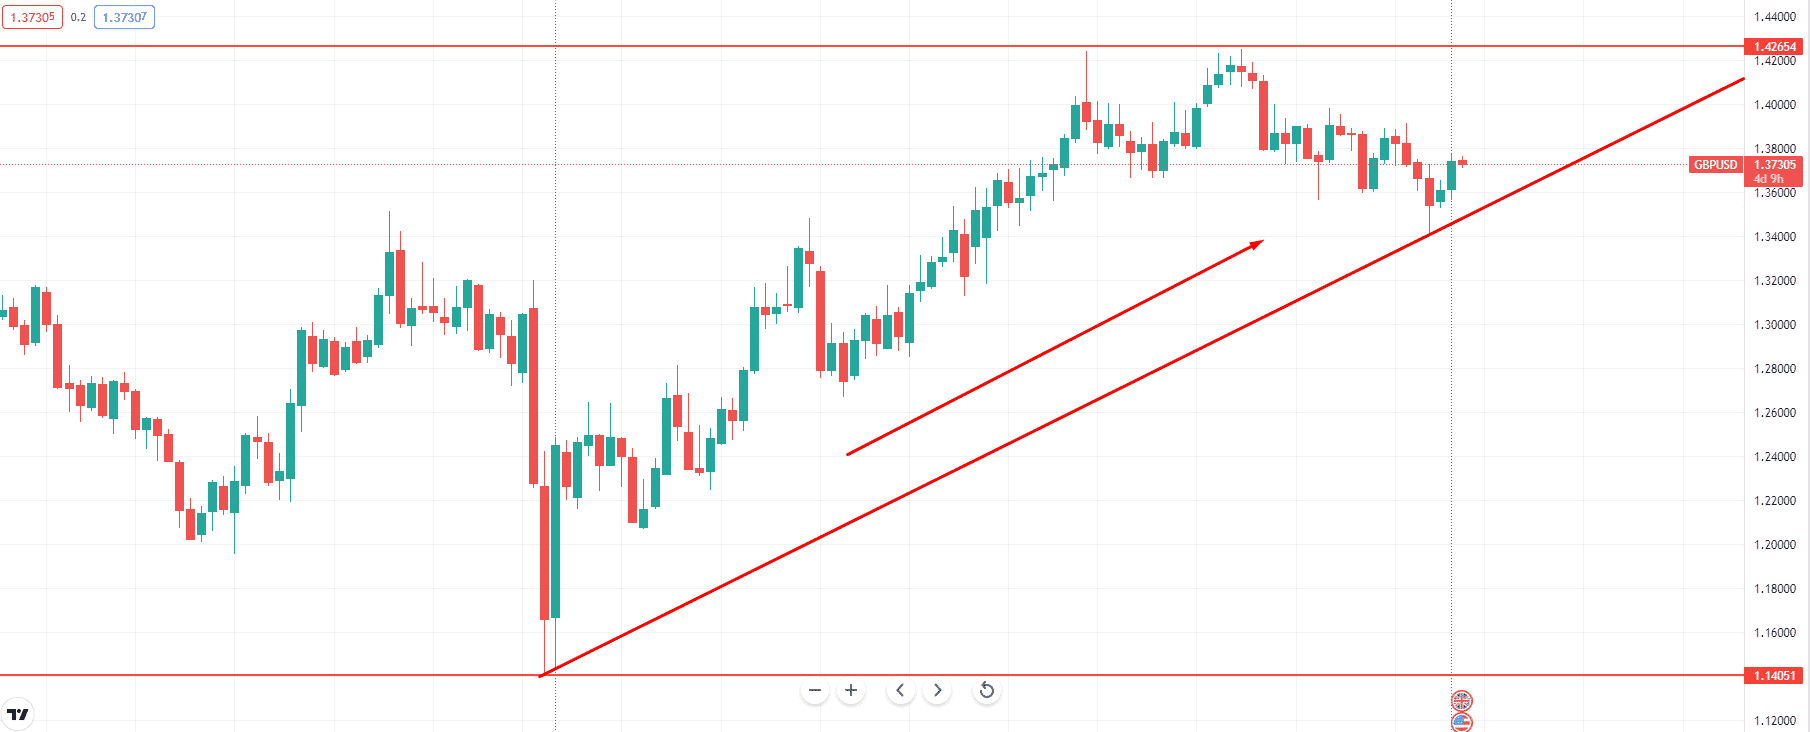
The GBP/USD chart above shows that an uptrend began about a year ago and has been a one-way trip ever since. EUR/GBP, on the other hand, has been in a downturn for around the same time. These tendencies, however, appeared out of nowhere.
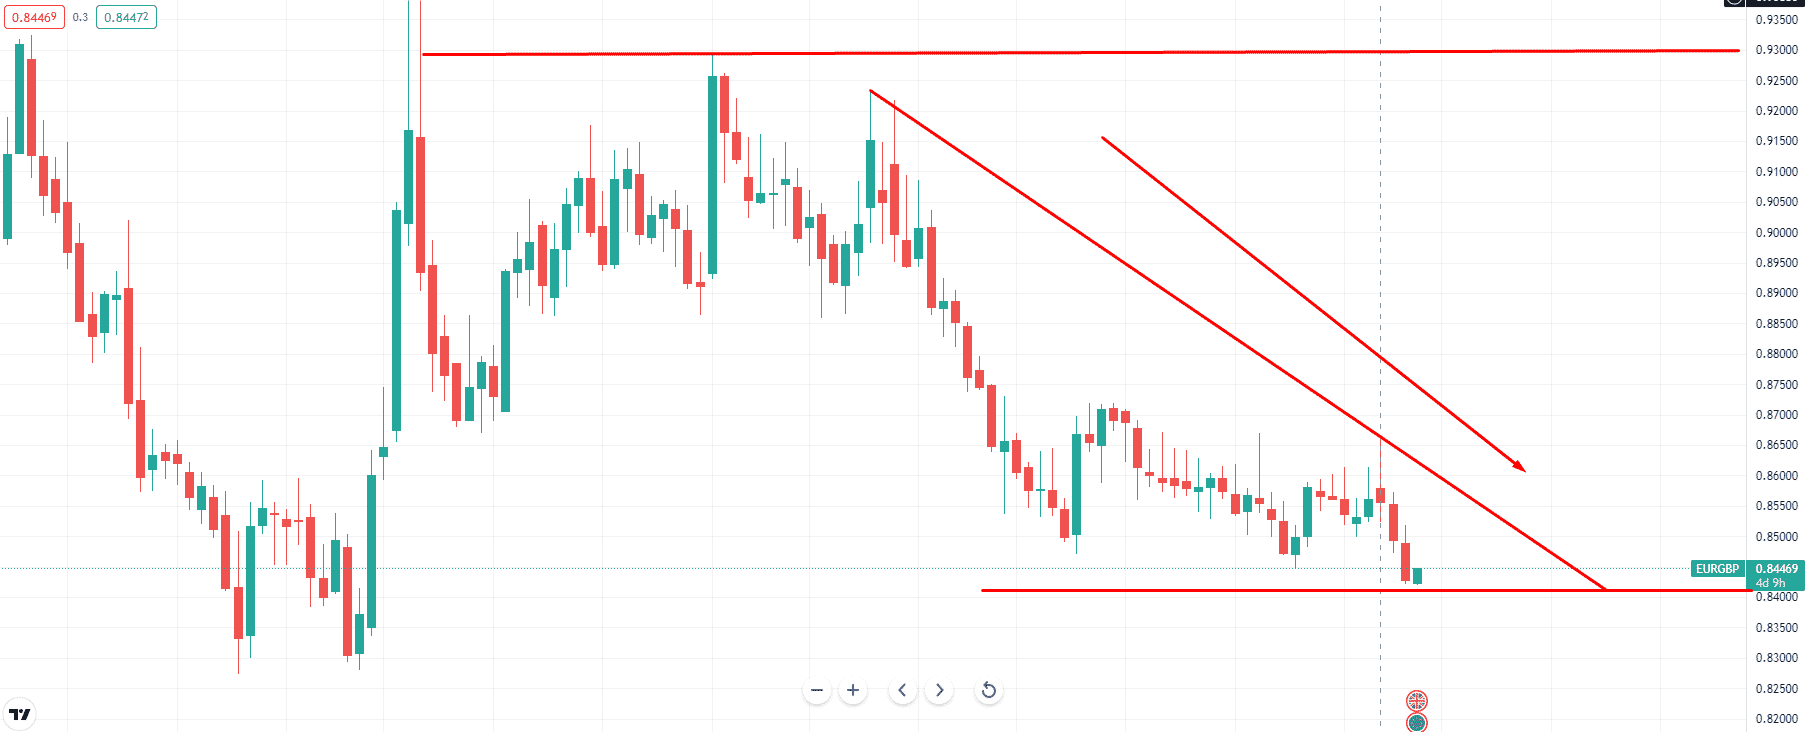
This has been made feasible by the economic data that has come out of the United Kingdom over the last two years, if not longer. Long before the trend formed, most news indicated that the British economy was on the mend. Since March 2021, a trader who correctly read and studied the data would have bought the Pound and pocketed roughly 2,800 pips.
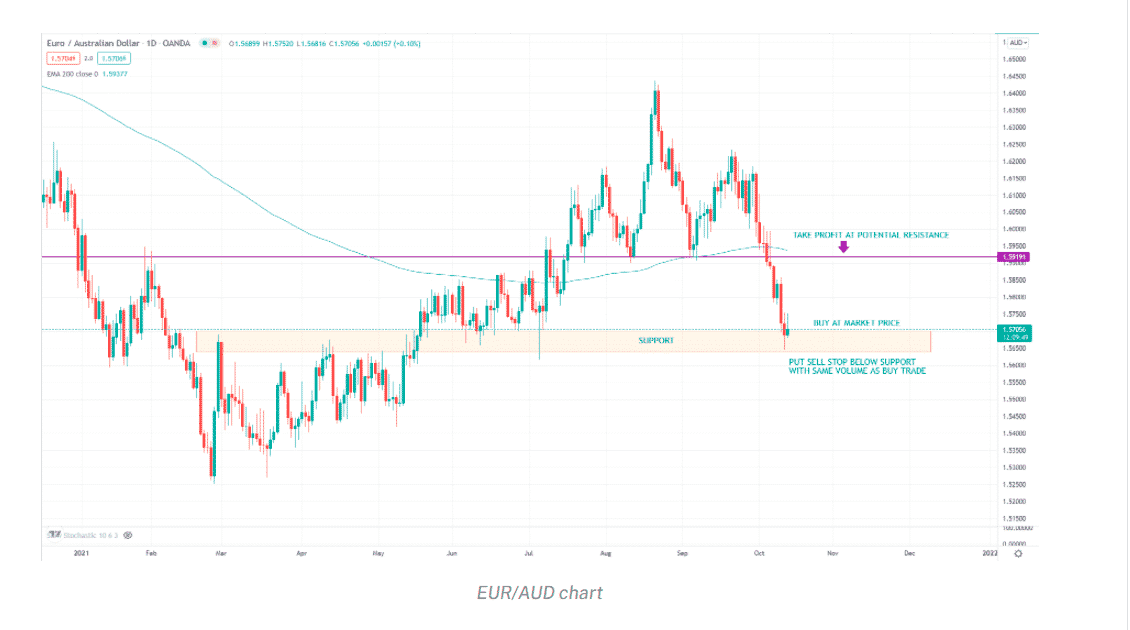
The following are the most significant economic events as they can trigger sharp price actions in the forex market upon their release.
- GDP –> (+) Good for currency
- Unemployment Rate –> (+) Bad
- Inflation (consumer and producer prices) –> (+) Good for currency
- Interest Rates –> (+) Good for currency
- Trade Balance –> (+) Good for currency
- Retail Sales –> (+) Good for currency
- Services and Manufacturing PMI –> (+) Good for currency
- Consumer and Business Sentiment –> (+) Good for currency
- Unemployment Claims –> (+) Bad for currency
- Home Sales –> (+) Good for currency
Now that we’ve demonstrated the importance of news trading, we need to learn about using news releases to our advantage.
Final thoughts
To summarise, both fundamental and technical analyses are helpful and valid, but they take distinct approaches to the market. Both analyses complement each other. Fundamental analysis confirms the direction of price action, while technical analysis helps to spot entry and exit prices.
It’s important to remember that no technical indication is flawless. None of them consistently provide trades that are 100 percent accurate. As long as you’re making money, you can employ either of the following methods or both.
