If given a choice, you should elect to trade with the trend. Although breakouts and reversals play out, they often mean going against the trend. One of the most familiar schools of thought about trading is Dow Theory. This theory counsels traders to assume that the trend will continue rather than reverse. The only time to trade the other way is when the market gives you enough confirmation.
One strategy that aligns with this theory is the trading channel strategy. It allows you to ascertain the trend first and then identify potential inflection points within the trend context. Therefore, channels perform two functions:
- Define the trend
- Identify entry points
Will you be successful in it? That is a tough question to answer. The biggest factor in your success is you. Learn the strategy in this article and master it.
What is a trading channel strategy?
A trading channel is one way of following price action. From time to time, the market likes to move in a channel, such as horizontal or inclined. When it happens, you are seeing a market that is more predictable than usual. You are likely to find entries that win. Since market behavior varies, you need to have multiple tools in your toolbox.
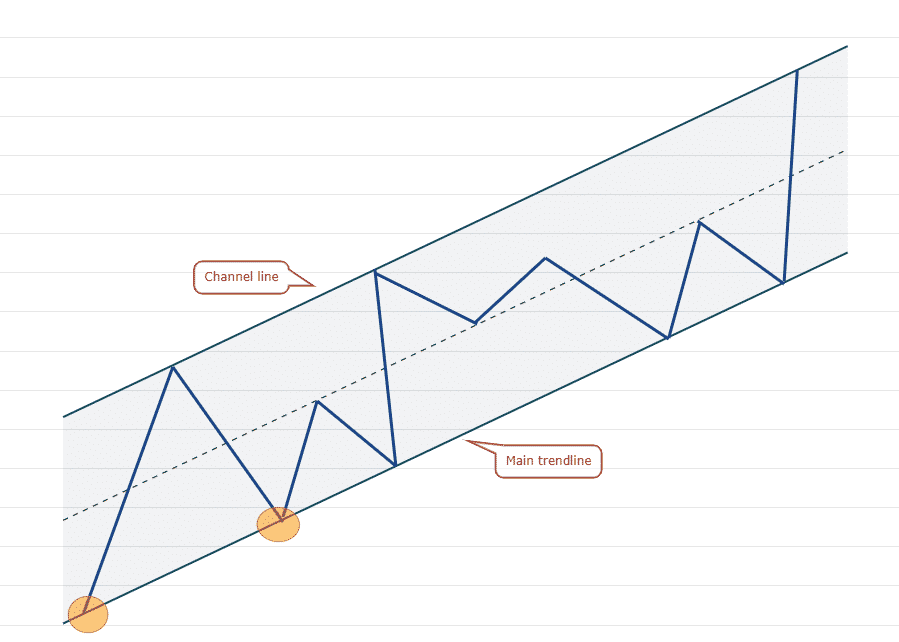
To use this strategy, you must draw the channel. You can either use a pair of inclined lines or flat lines. Alternatively, you can use an indicator to draw the channel for you automatically. Once the channel is drawn, you wait for the price to touch any boundaries and see its reaction.
How to apply trading channel strategy?
To trade this strategy, you must do four things, namely:
- Draw the channel
There are many ways to draw a trading channel. The channel can have straight-line or curved-line boundaries.
- Identify the market sentiment
Based on the channel drawn, you will perceive the market sentiment. If bullish, for example, you will look for buy entries.
- Wait for a rejection of channel boundary
To be safe, you should trade with the market sentiment only. For example, if the channel is inclined upward, you should not take sell trades. Instead, you must wait for the price to touch the lower boundary and find a rejection signal.
- Execute your trade
Once the price rejects a channel boundary, you are ready to trade. Execute your buy or sell trade, set the stop loss, and define the target.
Types of trading channels
As already stated above, not all channels are plotted using inclined lines. Here are the types of trade channels:
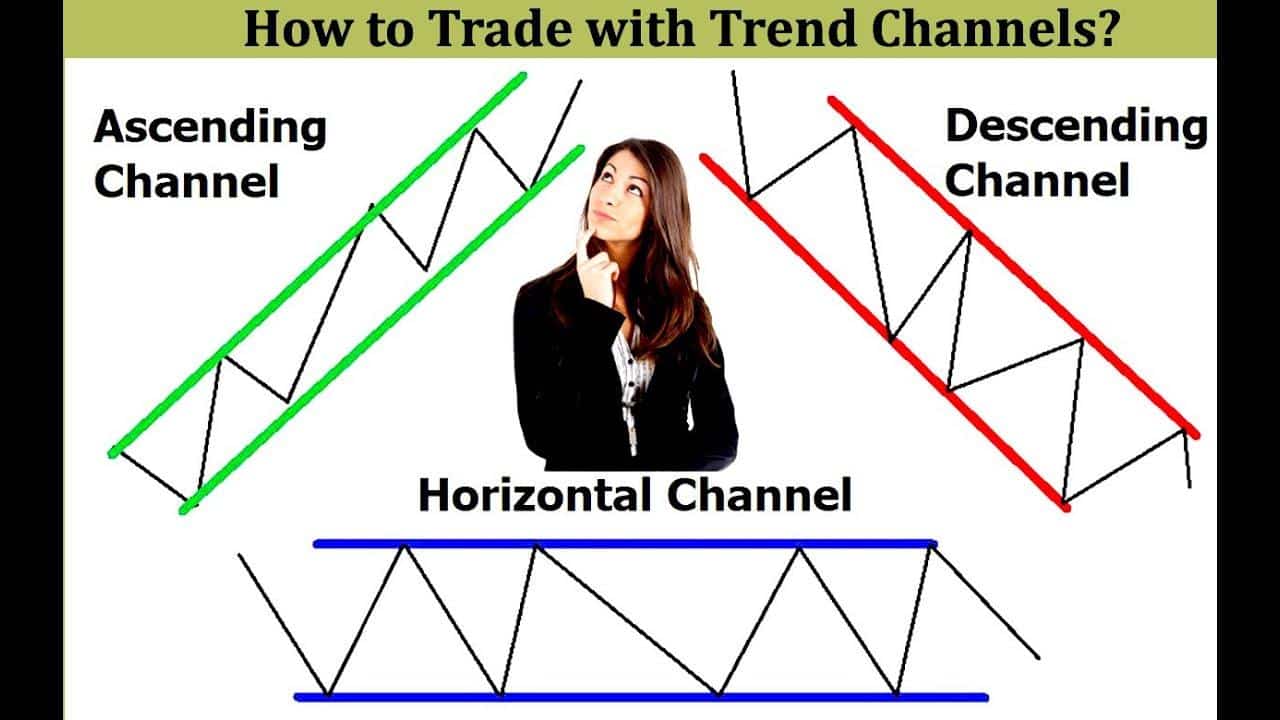
- Ascending channel
Two parallel lines with positive inclination make up this channel. The upper line provides resistance, while the lower line provides support. Since this channel carries a bullish sentiment, you should seek long entries. This will happen when the price touches the lower line.
- Descending channel
Two parallel lines with negative inclination make up this channel. The lower line provides support, while the upper line provides resistance. Since this channel has a bearish sentiment, you should seek shorting opportunities. This will occur when the price rejects the upper line.
- Flat channel
This channel is made up of two parallel horizontal lines. While the upper line prevents upside breakup, the lower line inhibits downside breakdown. This channel has a neutral sentiment. Here the market is ranging. As such, you can sell at resistance and buy at support.
- Envelope channel
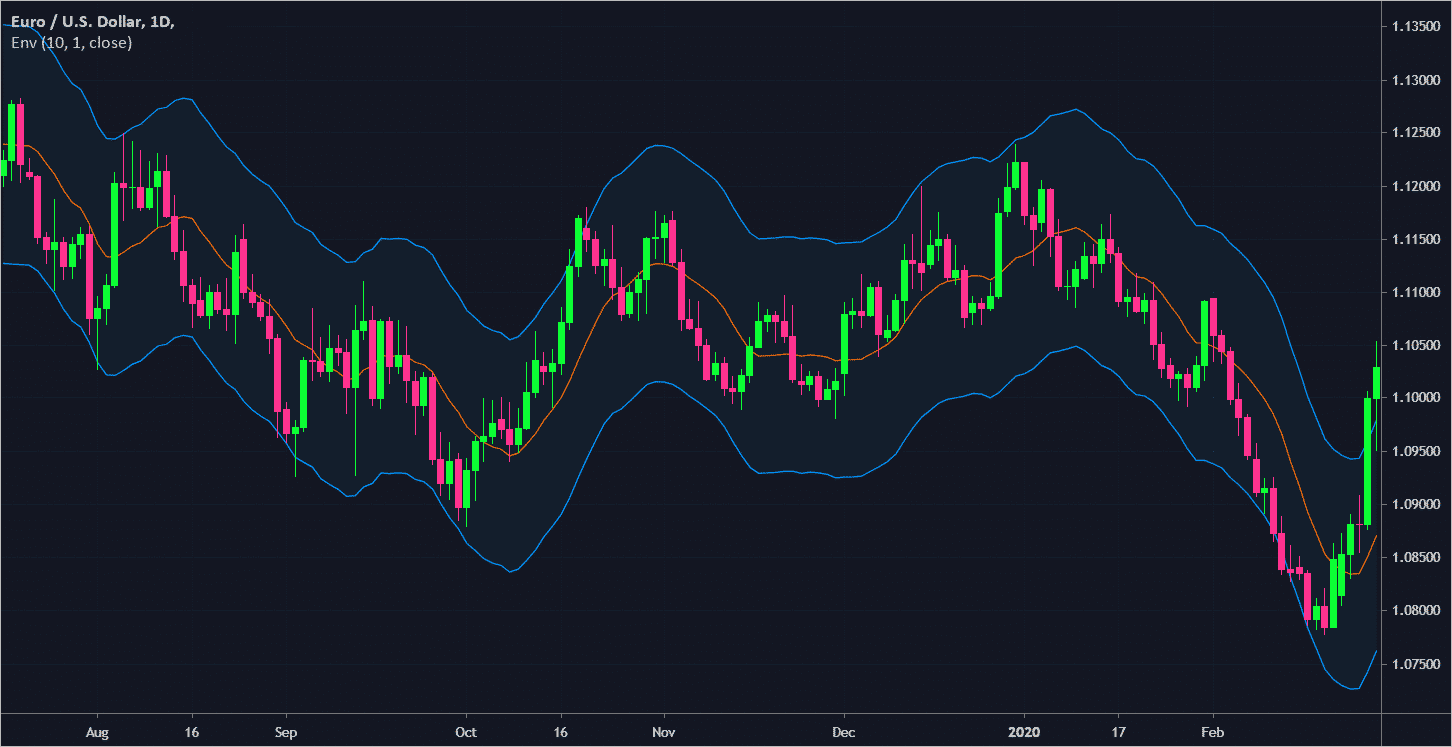
This channel moves in parallel with price action. It may contract or expand as the volatility dictates. While you normally draw the above trade channels manually, the envelope channel is drawn automatically by an indicator.
Some of the most common envelope channels are:
- Bollinger Bands
- Keltner channel
- Donchian channel
You can also create an envelope channel using a pair of moving averages (MA). Take one type of MA (e.g., EMA), and apply the same period (e.g., 8). Then apply one to the high price and the other to the low price.
Bullish trade setup
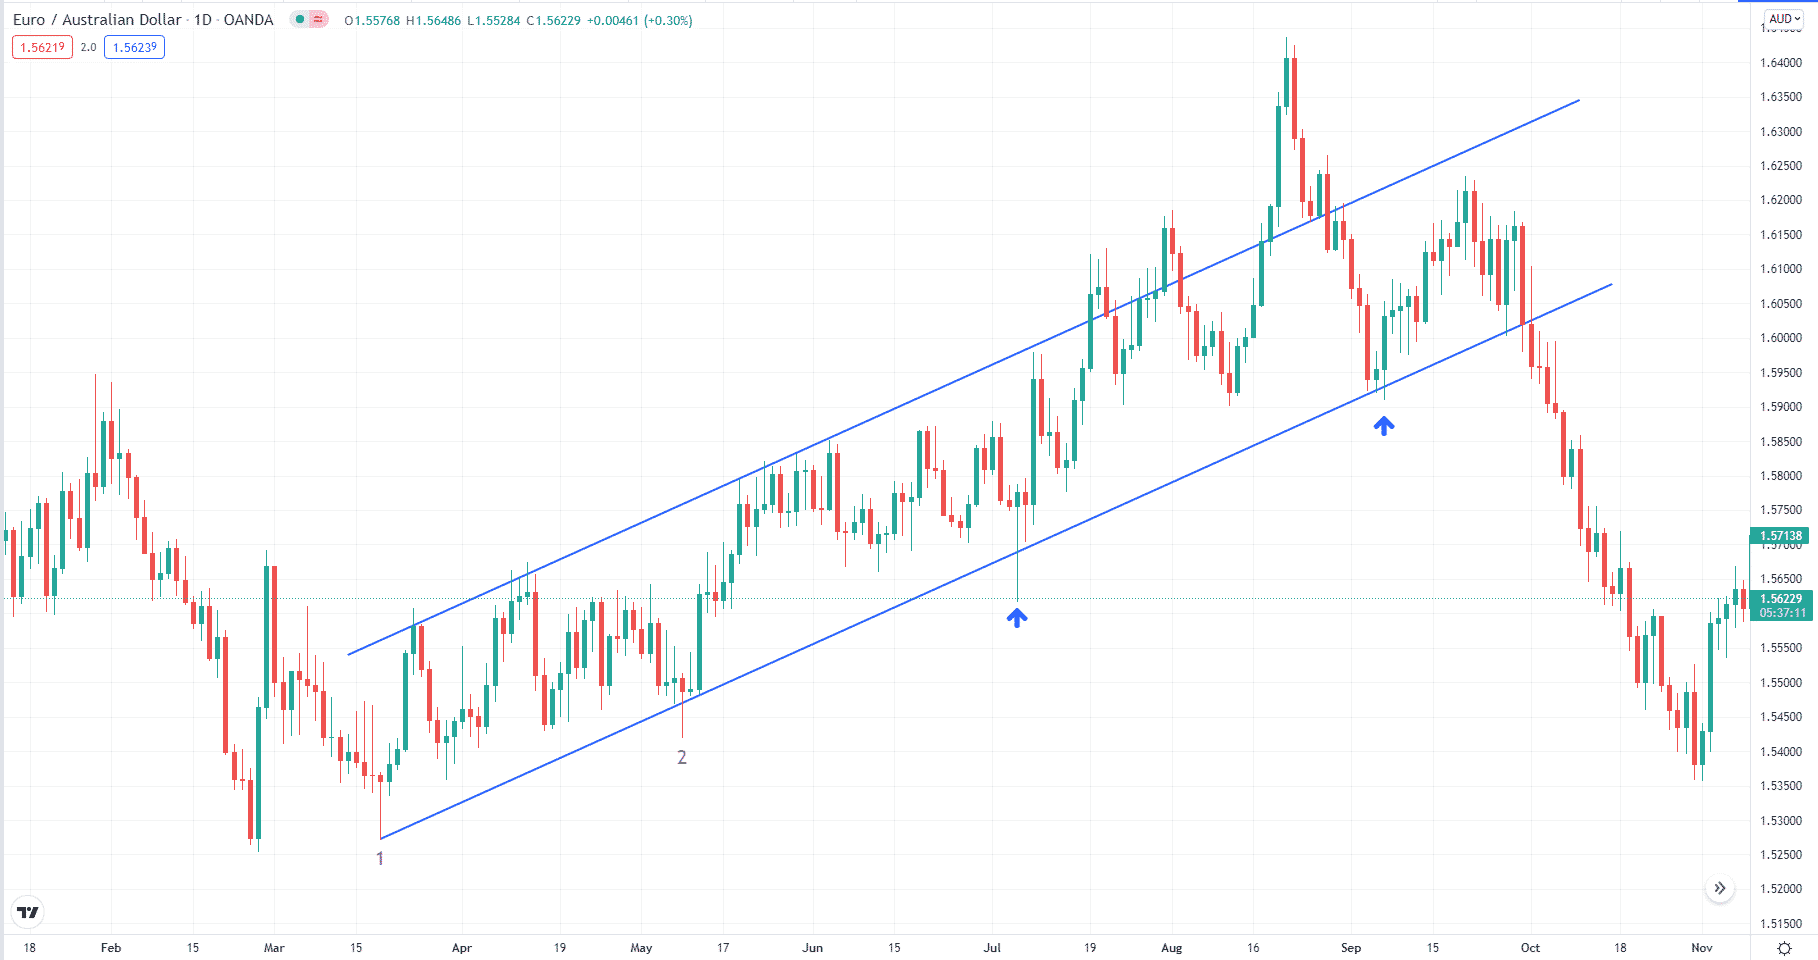
Let us consider a buy trade example. Shown above is the daily chart of EUR/AUD.
Entry
You would need two points to draw this channel. First, you join point one and point two with a line and project it to the right. Then copy this line and place it above the lower line. You should place the upper line at a location where it touches as many swing highs as possible.
Once you have drawn the upward channel, you are ready to look for buy entries. There are two occasions here where price touches the lower trend line before the breakdown.
- For the first entry, the trigger is a bullish pin bar rejecting the lower trend line.
- For the second entry, the morning star provides the entry signal.
Stop-loss
Once you open the trade, put the stop loss on the recent low and the take profit on the upper trend line. As you can see, the first entry plays out well, but the second misses the target.
Bearish trade setup
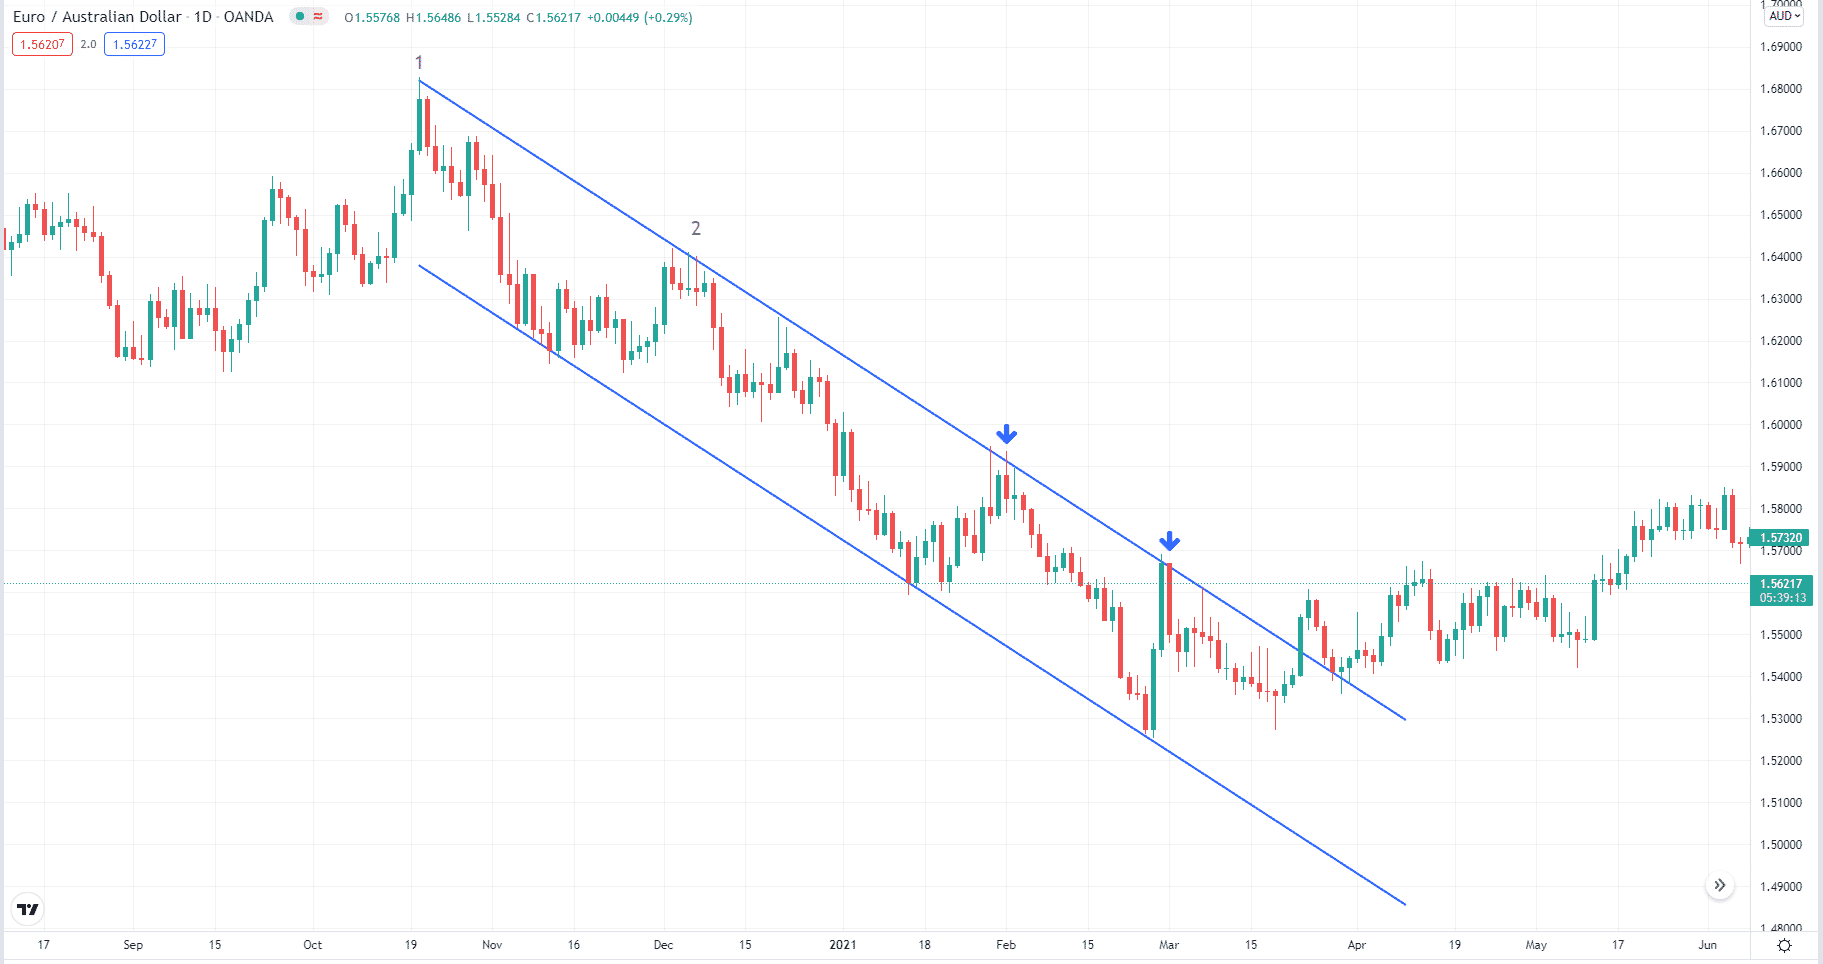
Let us take a sell trade example.
Entry
Displayed above is EUR/AUD daily chart. You need two points to draw this channel.
- First, you join point one and point two with a line and extend it to the right.
- Then copy this line and place it below the upper line.
- You should place the lower line at a location where it touches as many swing lows as possible. In hindsight, this channel is a perfect example.
Once you have drawn the downward channel, you are ready to look for sell trades. Same as above, there are two instances where price touches the upper line before the breakup happens.
- For the first entry, the trigger is a red candle rejecting the upper trend line.
- For the second entry, the dark cloud cover provides the entry signal.
Stop-loss
Once you open the trade, put your stop on the recent high and your take profit on the lower trend line. Again, same as above, the first entry plays quite nicely, but the second entry misses the target.
How to manage risks?
Your job as a trader is to manage risk. If you are a technical trader, the best way to do that is to use a stop loss. This will keep your account safe in case your market analysis fails you.
With a stop loss, you can set the trade risk even before you trade. Ultimately, the risk depends on the lot size, which in turn rests on the risk amount. The risk amount must be a certain percentage of your account. Most professional traders recommend risking one to two percent per trade.
Final thoughts
This strategy is suitable for new traders. It will allow you to avoid over-trading and to trade only when a clear trend is in place. Because you must wait for a channel to form fully, you will trade less often and avoid unnecessary losses. When you see a channel forming, you know that a trend exists. When you see a signal along with the trend, you see this trade has a good chance of winning.
Based on the examples given above, it appears the best entry is on the first trade, which happens right after the channel is confirmed. On the next touch, the price fades away only briefly without touching the other end of the channel. Then it breaks out outside of the channel and makes a new trend. This market behavior is something you must examine in more depth if you like to use this strategy.


