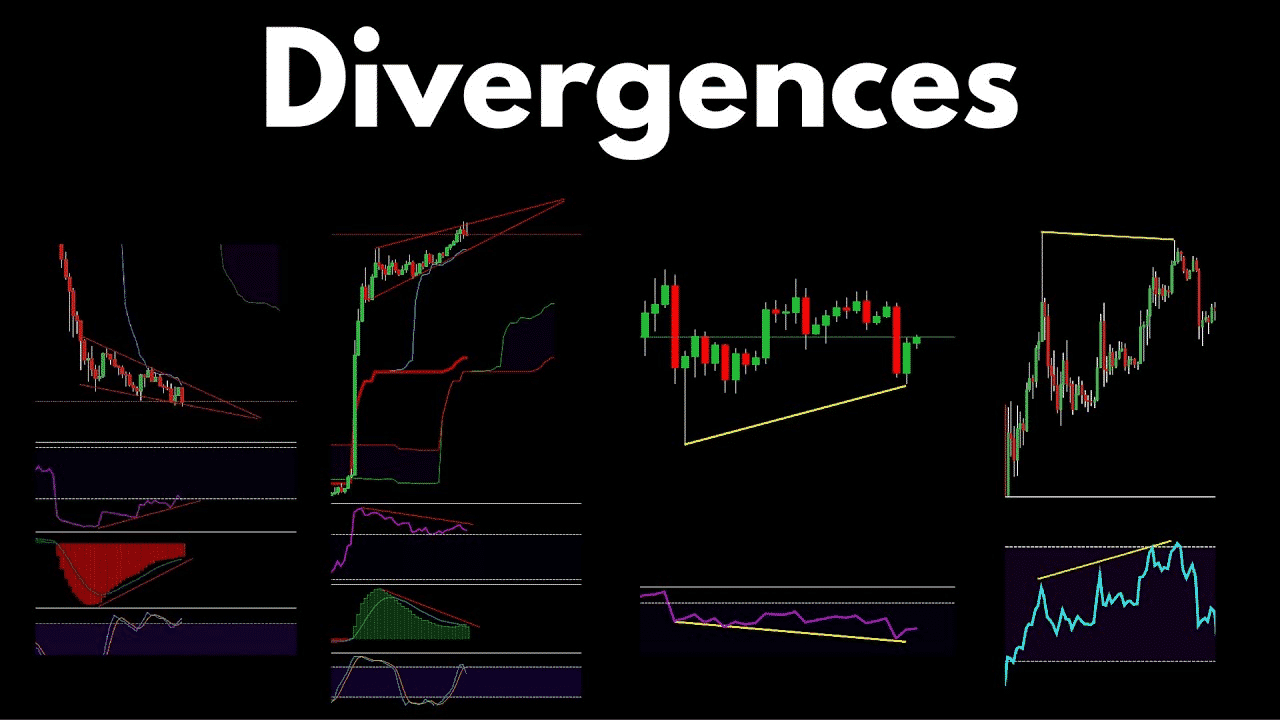
Divergence is a condition when an indicator does not reflect the state of price action. When an indicator and price are not in harmony, it suggests something amiss is going on. Generally, it means market strength is declining. Another line of thought is that price reaches a level too quickly, and the indicator fails to catch up in time.
Technically, divergence occurs in two scenarios:
- The first scenario is when the price makes a higher high, but an indicator makes a lower high.
- The second scenario is when price creates a lower low, but an indicator creates a higher low.
When these scenarios happen, traders expect the price to reverse or correct anytime soon.
Best divergence indicators
In subsequent sections, you will learn about four indicators that provide quality divergence signals. Each of these four indicators works very well for this purpose. Each one has its strength and is suitable for a specific market condition. Try them out and see which one works best for you.
Tool № 1: Relative strength index
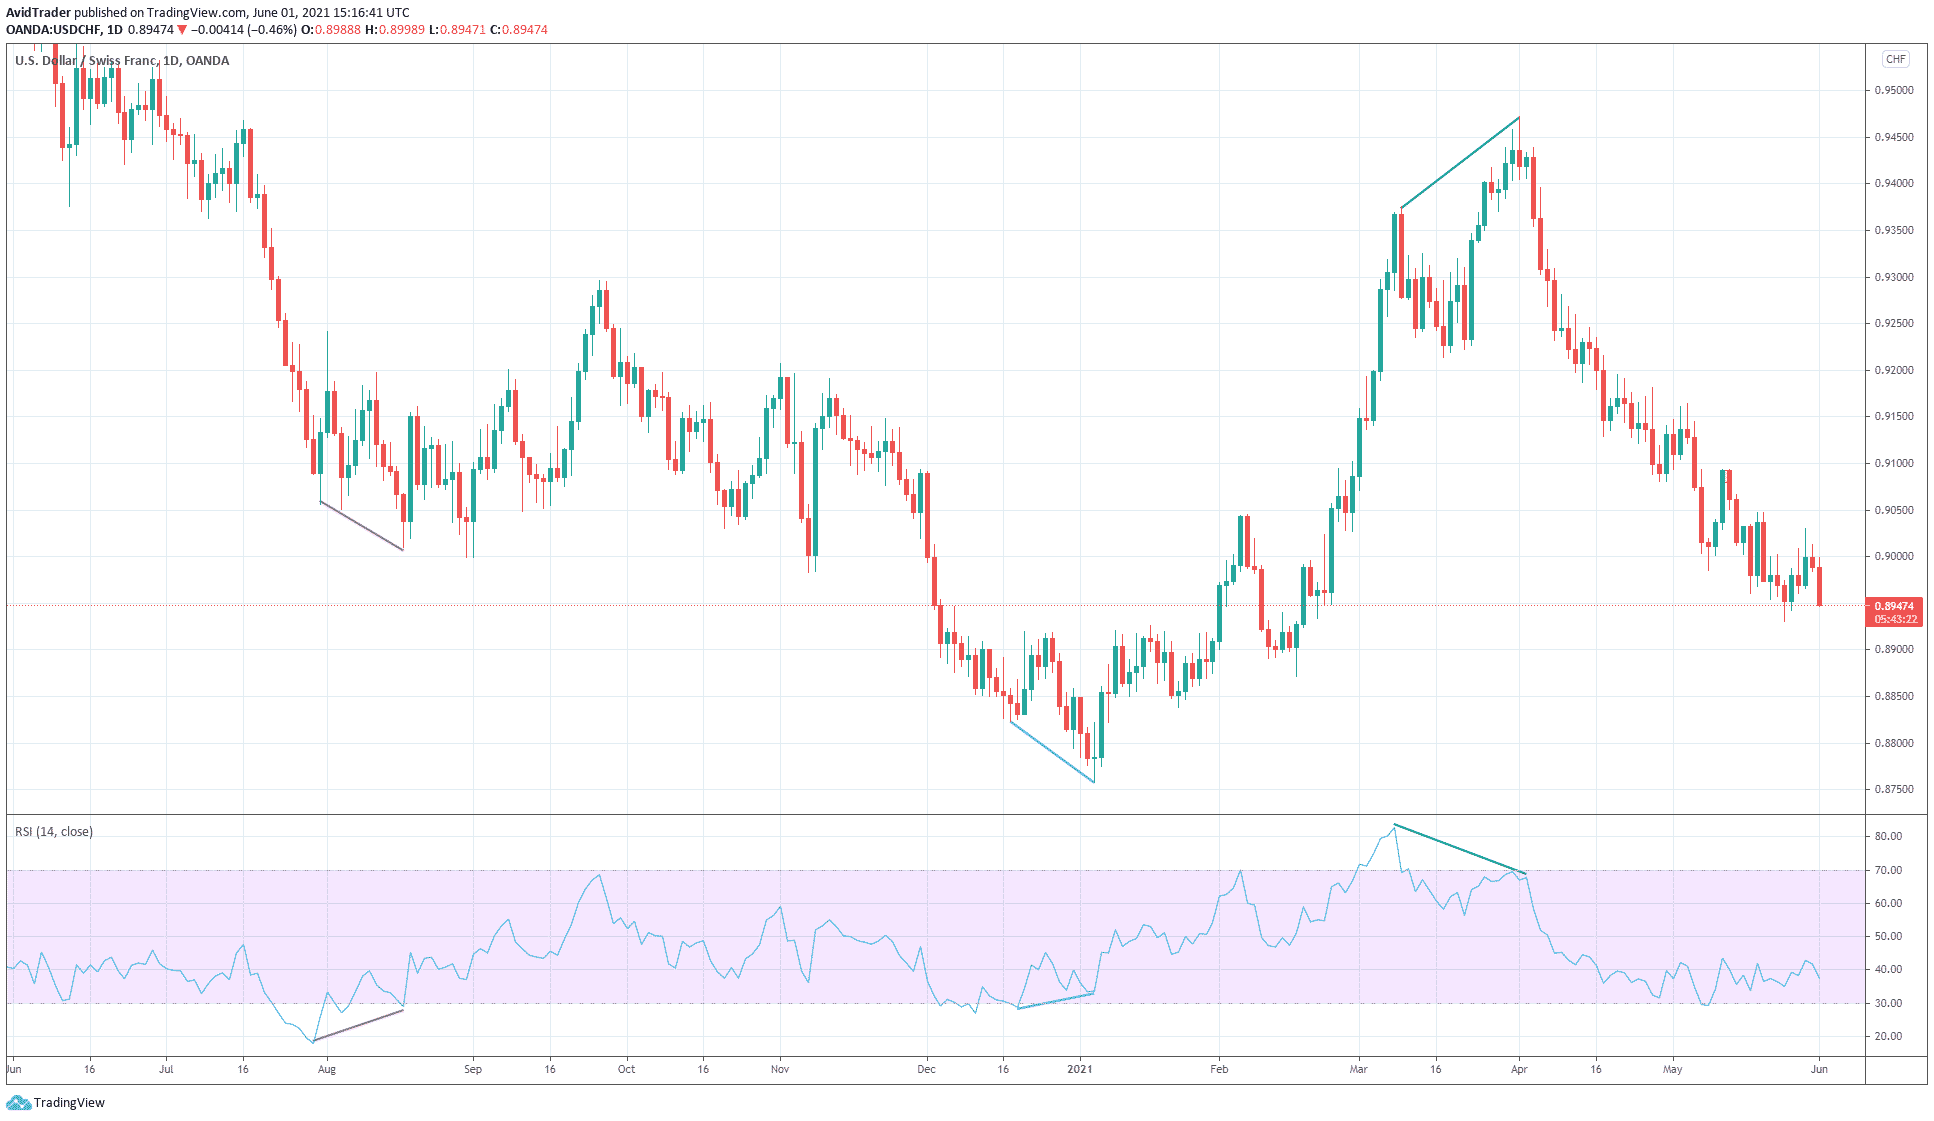
The RSI is one of the best indicators around that provide divergence signals. See the indicator in action in the above USD/CHF daily chart. Three such signals are highlighted on the chart. Look at how the price reacts following each divergence signal.
With the RSI, you will come to realize that divergence trades are all over the place. You can find it on any instrument and period. The best policy is to select trades that meet your criteria. Not every deal is going to be a winner, but plenty of these trades will.
Tool № 2: Stochastic
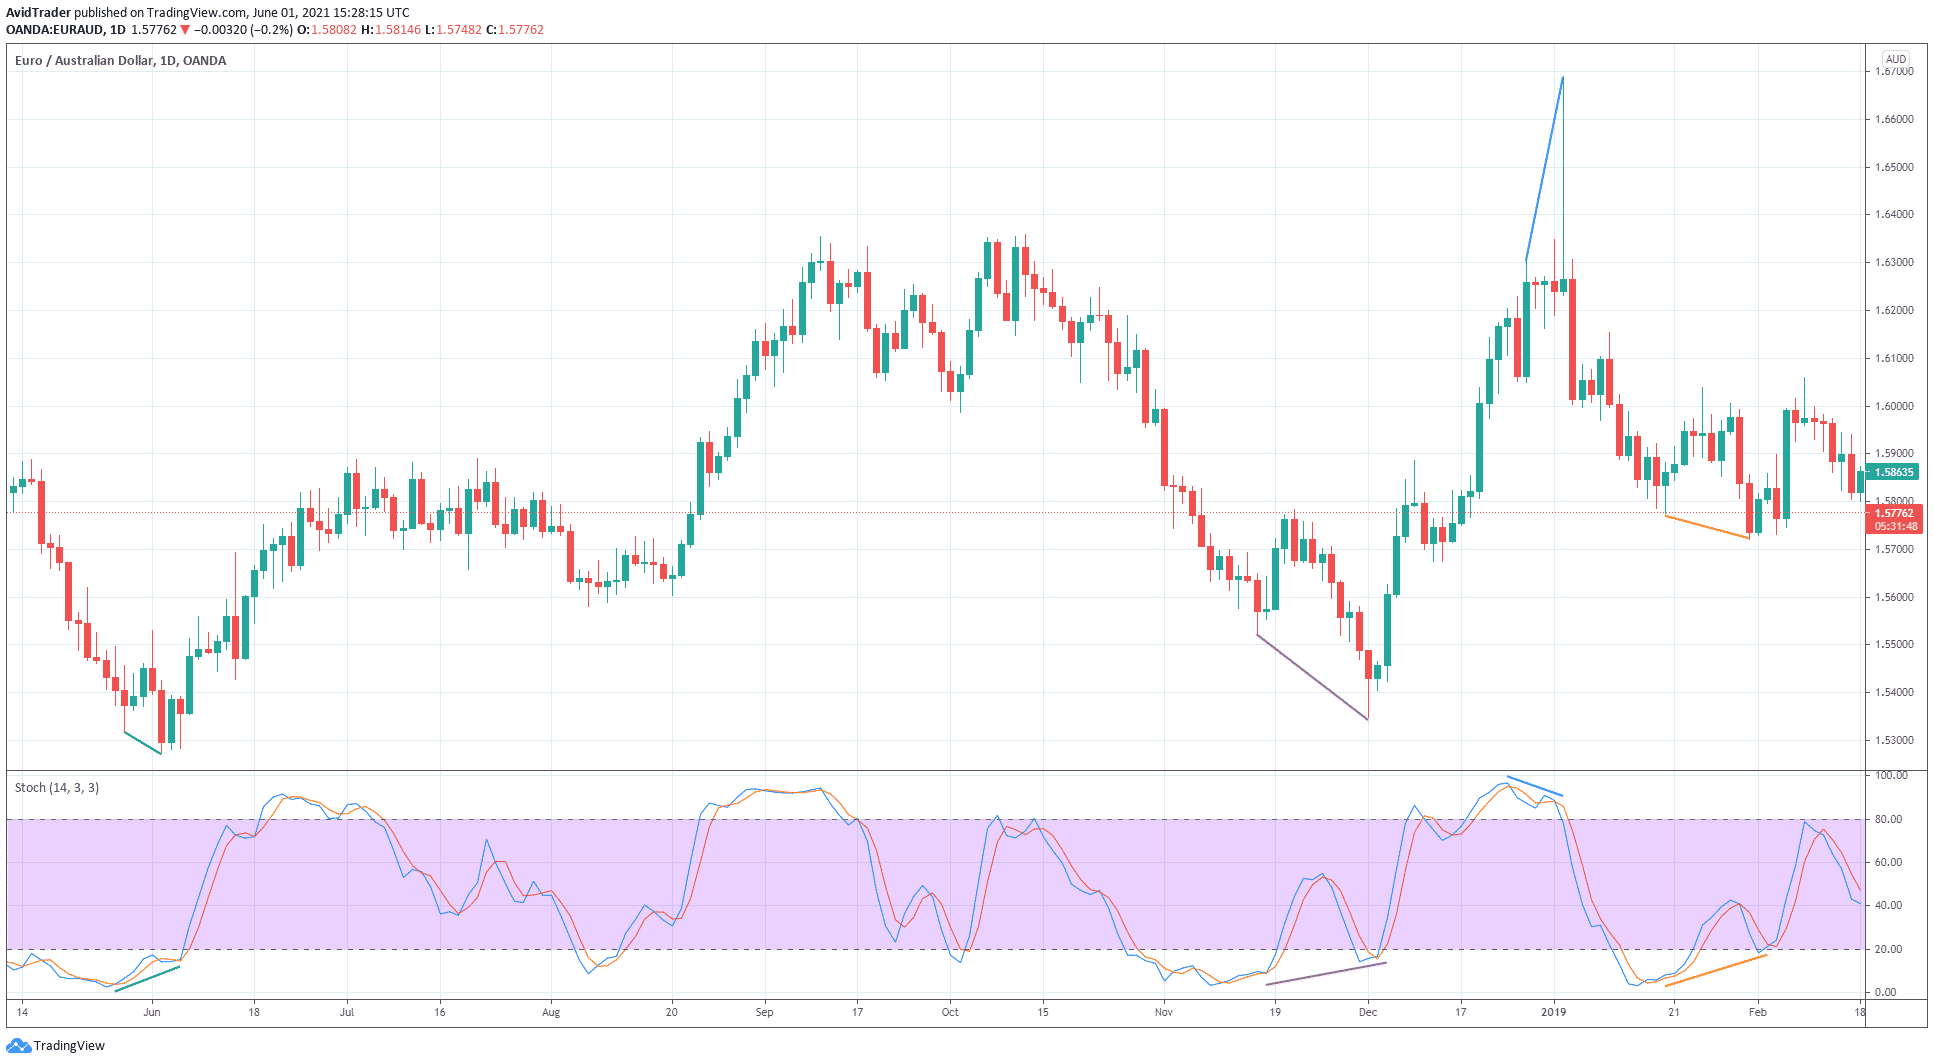
Stochastic belongs to the elite group of indicators that provide quality divergence signals. Unknown to many traders, this indicator can generate divergence signals even with a handful of candles. Other indicators do not have this capability. For example, the above EUR/AUD daily chart shows an instance where a divergence forms with five candles.
There are four divergence setups on the chart above. While the second and fourth divergences seem apparent, the first and third are pretty elusive. Without a trained eye and with limited trading experience, you might not have seen a divergence in those instances.
Tool № 3: MACD
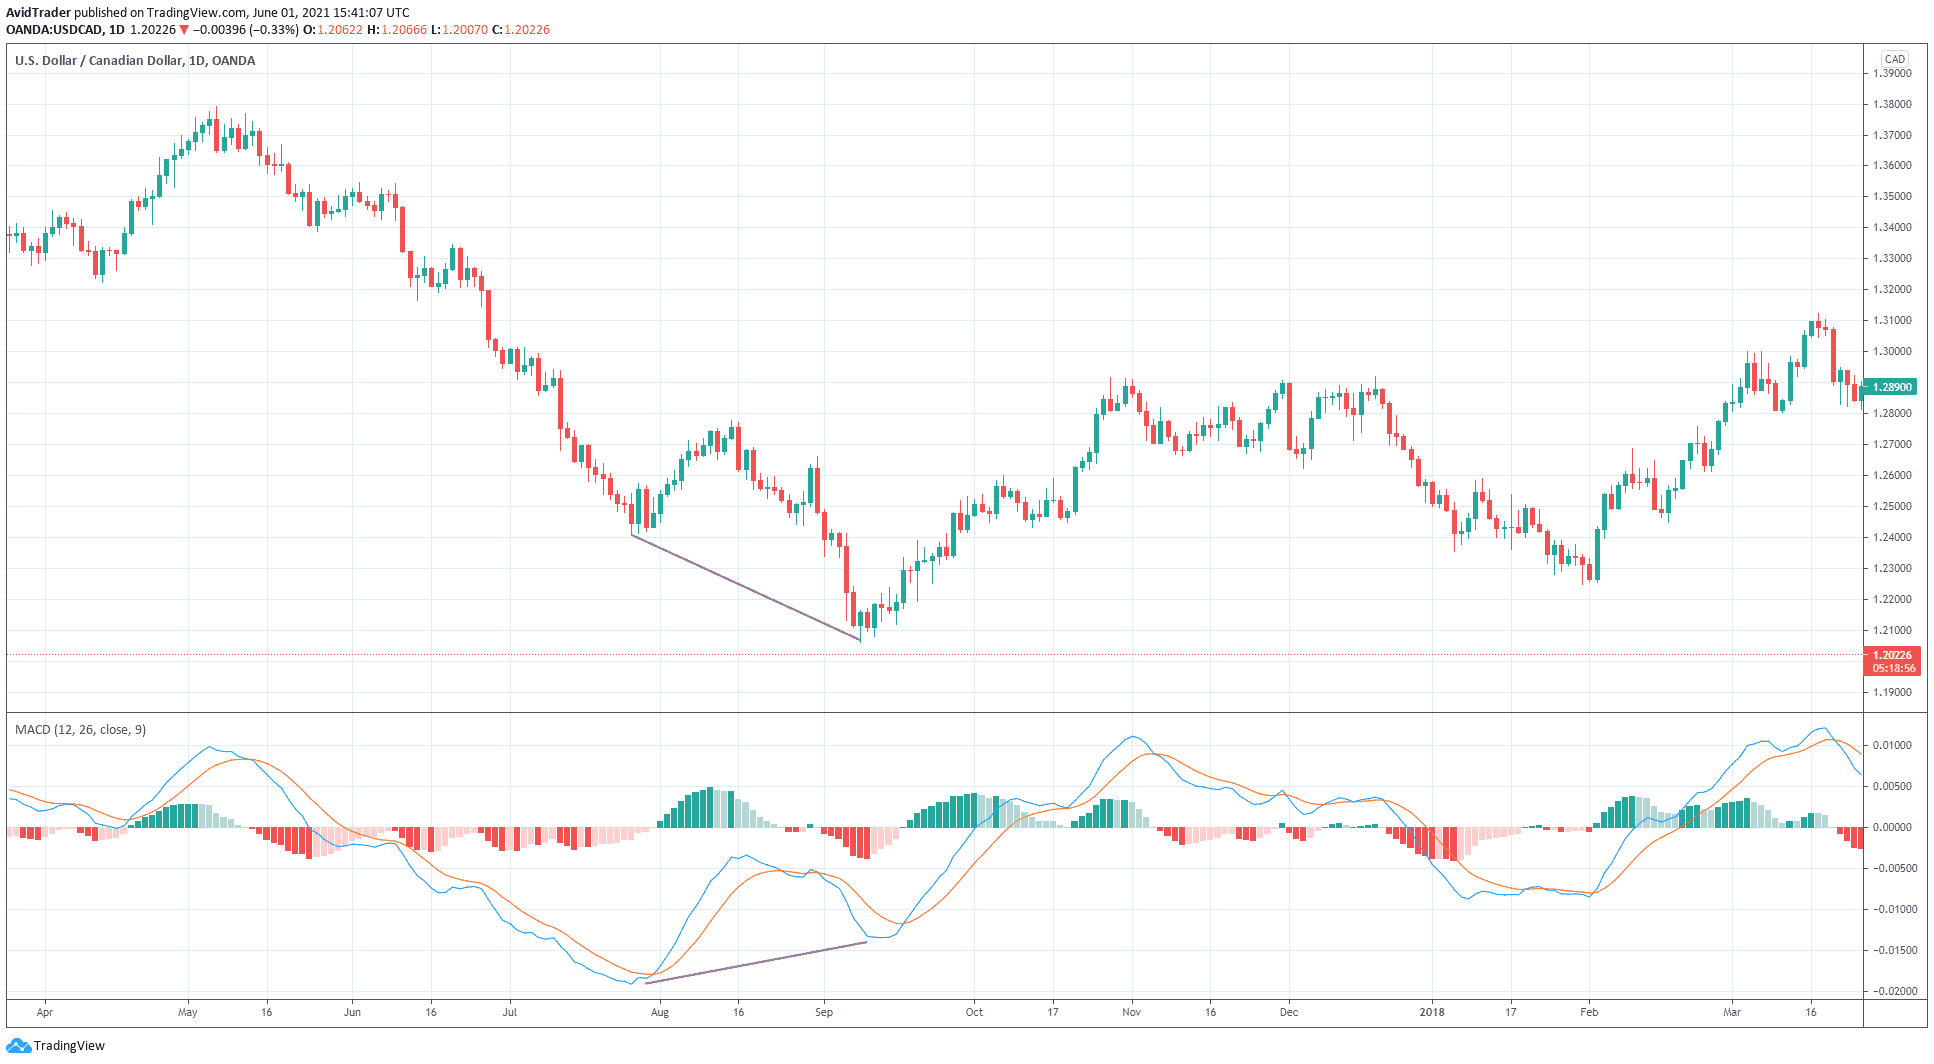
The MACD is one of the most potent divergence indicators in existence. With this tool, it is possible to take divergence trades even against the trend. Taking those signals will serve you quite handsomely in terms of profit. The only challenge is the placement of the trade stop loss.
Often, when a market has trended for too long in one direction, a significant divergence setup occurs at the end of the move. Such is the case in the daily USD/CAD chart above. This divergence setup is too apparent to ignore. When this kind of setup comes about, market reversals happen with a high degree of certainty. Moreover, these reversals are ordinarily sharp and prolonged.
Of course, not all divergence signals provided by MACD are the same in terms of effectiveness. The secret to taking high-probability MACD divergence trades is in the location of the MACD line. If the MACD line has drifted too far from the zero lines and divergence occurs, that setup is golden for the divergence trader.
Tool № 4: Traders dynamic index
The traders’ dynamic index (TDI) is a relative newcomer to technical analysis than the other tools in this list. However, it is nonetheless as effective.
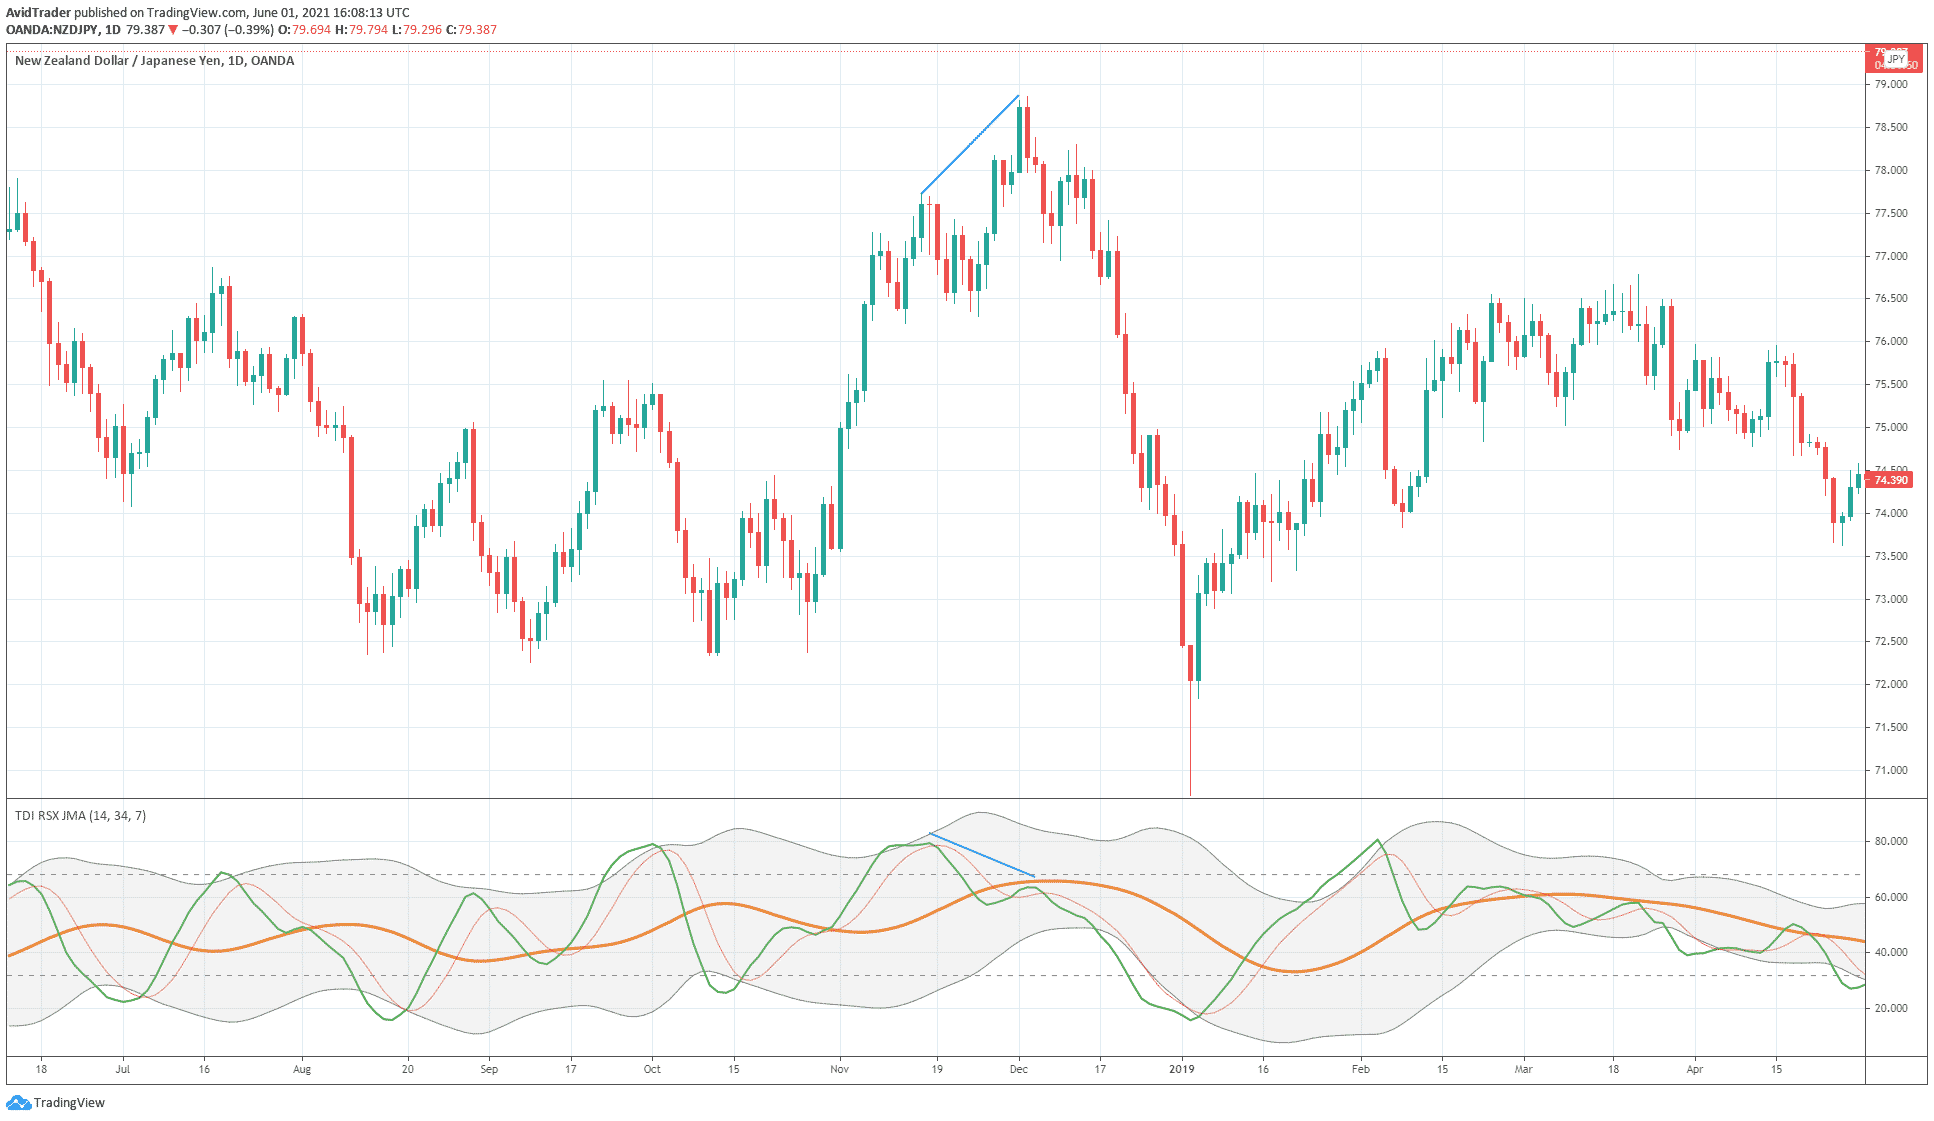
Consider the bearish divergence in the NZD/JPY daily chart above. It is evident that the price made a higher high, but TDI made a lower high. In addition, the signal forms near the overbought territory. Therefore, this sell entry has two factors supporting it. First, look at the monstrous sell-off that ensued thereafter.
The above example shows one of the advantages of using the TDI. It can tell the market condition, be it overbought or oversold when the divergence forms. Plus, the TDI lines are very smooth. So you can easily see the divergence when it happens.
Since there are many types of TDI indicators out there, make sure that you use the same version as depicted in the above chart. For example, in tradingview.com, this version is called TDI RSX JMA. In addition, you can find a similar indicator probably by another name for other platforms such as MT4 or MT5.
Trading divergence with support and resistance
You might be wondering why there are many losing traders when many tools are available online for free. In addition, you can get free material about trading strategies similar to this article out there. The answer lies in how you use information or tools available to you.
As with any trading strategy, it is better to use the divergence in combination with other tools. For example, you may use such tools as moving averages, trend lines, and others along with divergence. So the goal is to improve the probability of the success of divergence trades.
Probably an essential tool to pair divergence with is classical support and resistance. The reason for this is simple. Why do you think price reverses when it touches support and resistance levels? The answer is that price meets an obstacle that impedes its movement.
Another reason for the reversal is that price itself might not have enough strength to break through an obstacle that gets in its way. The best indicator of this price is divergence. Therefore, if price momentum is weak and an obstacle is intense, you can expect the price to fade when it makes contact.
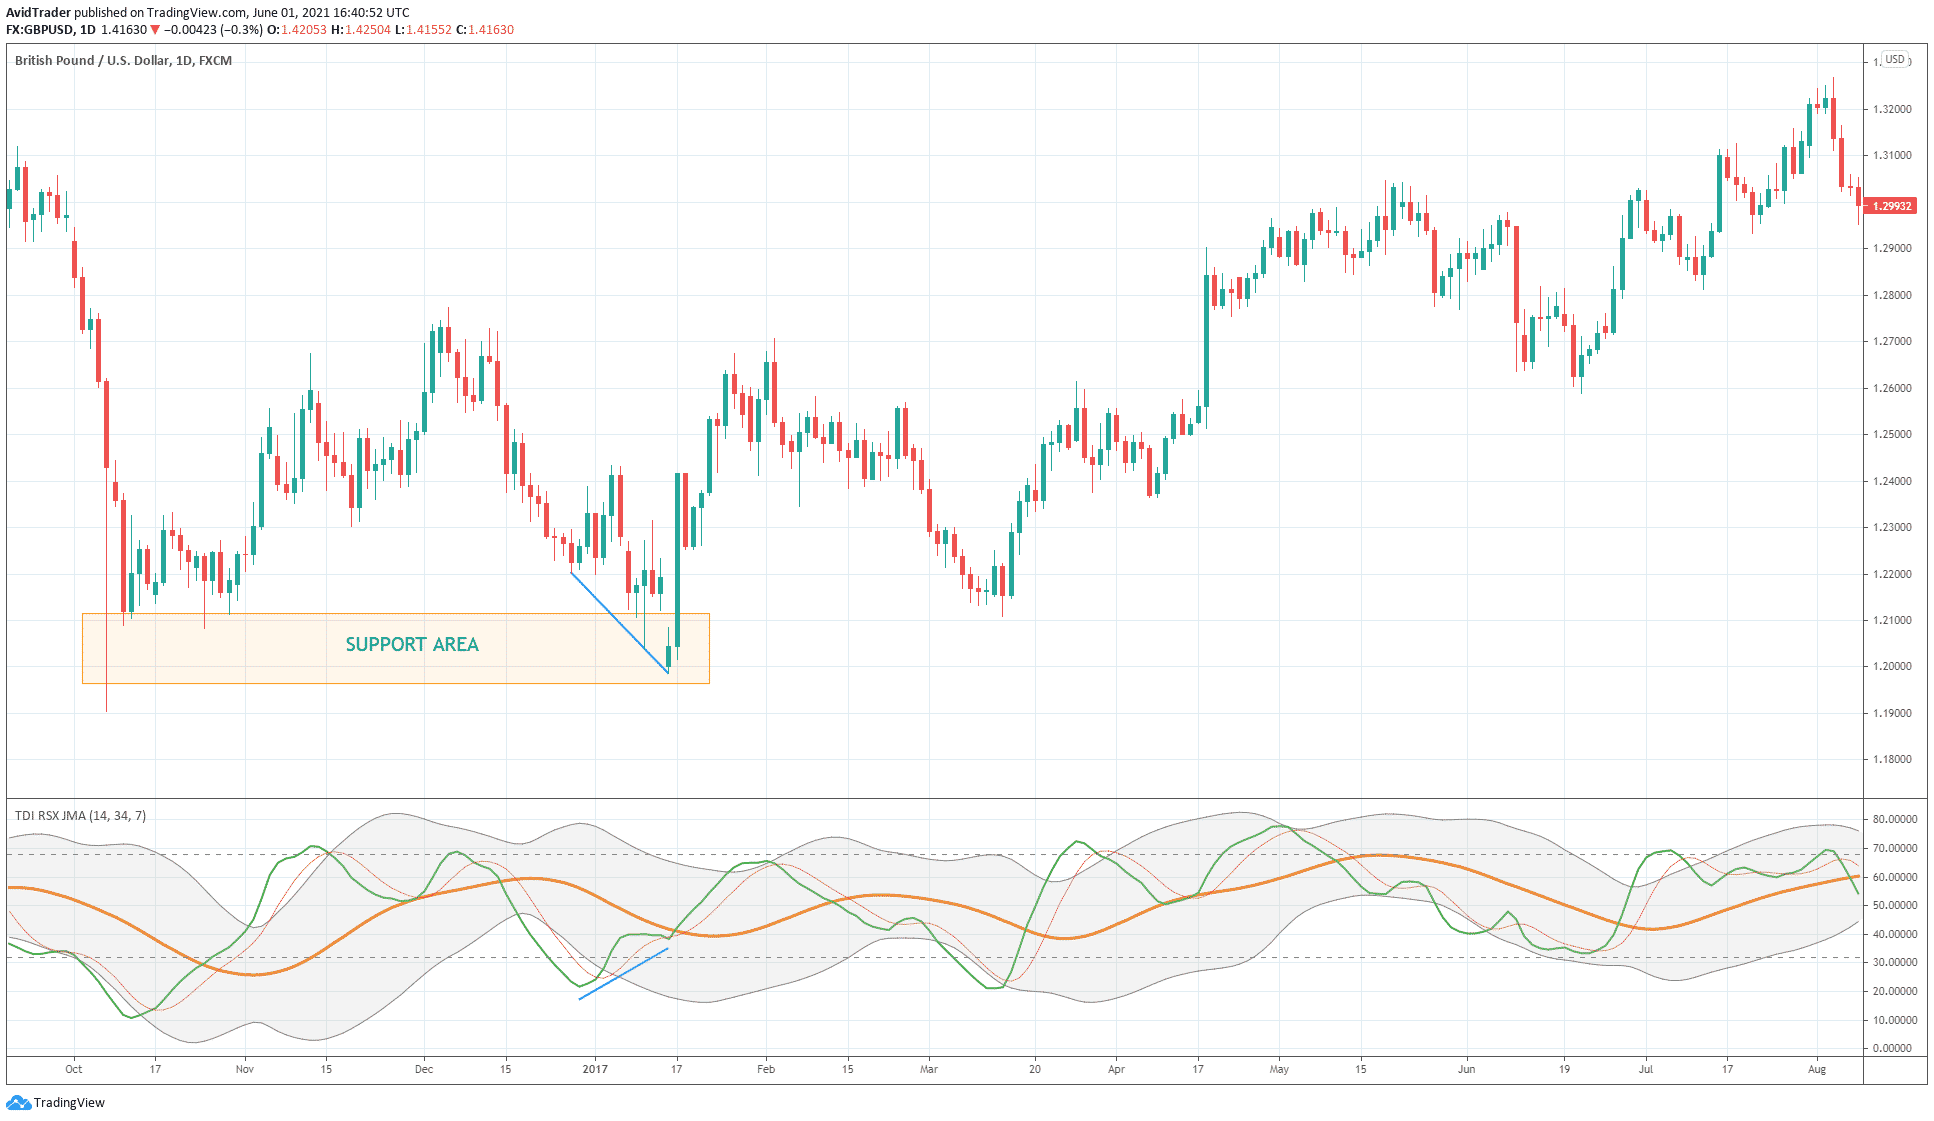
Consider the GBP/USD daily chart above. You can tell that support exists in the shaded area because the price rejected it a couple of times. The final turn occurred when the price retested the area, but the indicator showed divergence. It means support was strong, and the price was weak to break through that zone.
Final thoughts
You can factor the trend and multiple time frame analysis into the discussion on finding high-probability divergence signals. That is a good thing to explore on your own.
When trading divergence, keep in mind that signals in higher time frames are more effective than those occurring in lower time frames. Their effectiveness increases several-fold when the divergence is too obvious or significant enough that it almost jumps out at you.
As presented in this article, it is best to trade divergence around support and resistance areas. However, this trading concept is not widely known among traders. Now you have an idea of how best to trade divergence. It is time to test it out in the markets.
