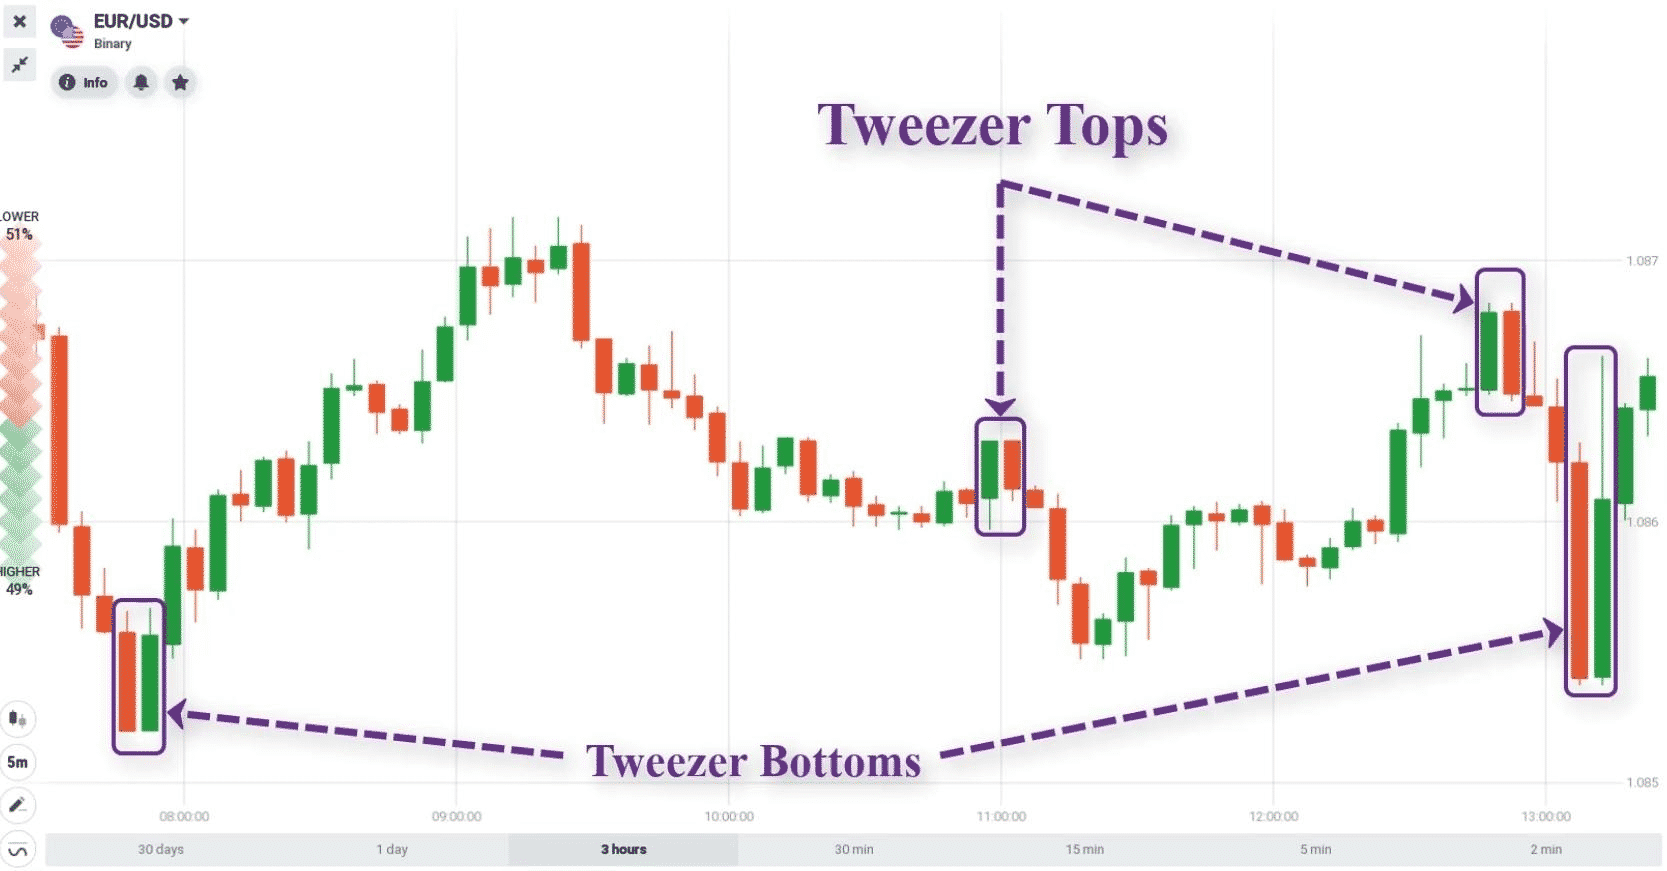
A Tweezer is a technical analysis pattern consisting of two candlesticks. It identifies the market top and bottoms of downtrends and uptrends. Tweezer top & bottom are collectively called Tweezers, which are meaningless when they appear apart from a downtrend and an uptrend. Moreover, they are unproductive during the choppy price phase as they can also distract the traders from moving in the right direction.
The article will discuss these figures, how they work, and some best tips to overcome the commonly occurring problems with the pattern.
What is the Tweezer top pattern?
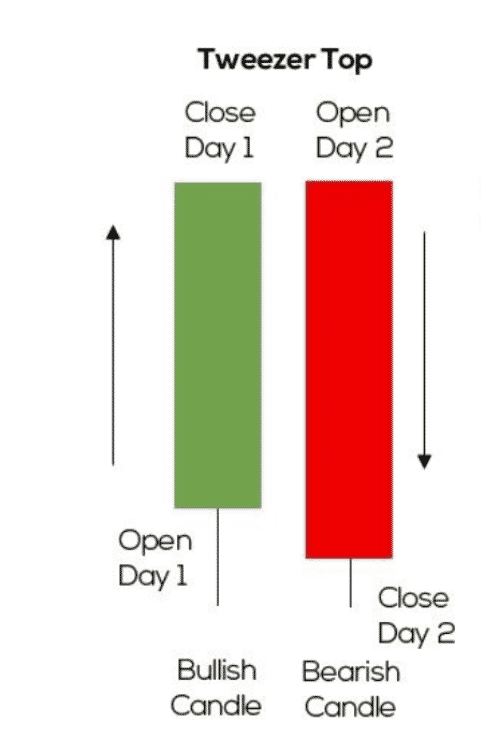
It’s a bearish reversal signal that occurs at the end of the uptrends and consists of two patterns:
- The first one signifies bullishness that will continue in the same direction.
- The second one being bearish determines the trade changing soon.
Both usually rise to the same highs.

Professional traders usually use Tweezer top patterns. This can signify a price reversal quickly and has very high accuracy. In addition, while using this figure, you can consider the down order securely.
What is the Tweezer bottom pattern?
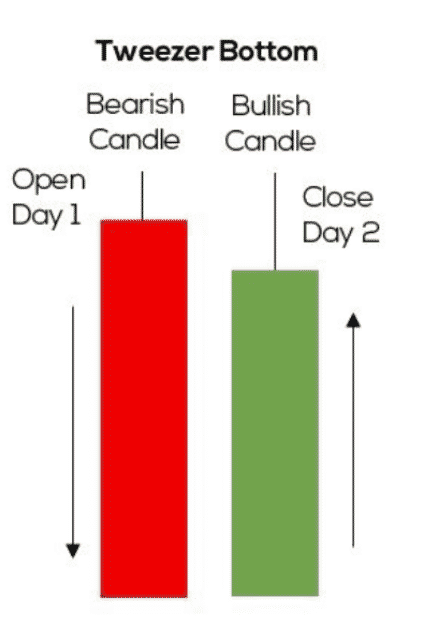
Tweezer bottom patterns are conversely different from the Tweezer top pattern. It’s a bullish reversal signal that arises at the end of the downtrends. It comprises two candlestick patterns.

The first candle represents the bearish trend, and the second candle illustrates the bullish trend with the equivalent length to the first one as the price rises in the opposite direction.
When it spots at the downtrends, it conveys the decreasing to increasing investor and positively impacts decisive transactions.
What does the Tweezer top pattern signify?
The trend is an uptrend formed by a Tweezer top pattern. The first bullish signal shows the momentum of the movement continues. The following day, bearish signals spot at the same level and indicate resistance. The bullish signals used to mean that prices would rise, but now buyers aren’t buying higher prices.
The top-most candles with almost the same high indicate the resistance’s strength and signal that the uptrend may get reversed to form a downtrend. When the bearish candle forms, it means that the bearish reversal already occurred yesterday.
What does the Tweezer bottom pattern tell us?
The trend is a downtrend formed by a Tweezer bottom pattern. The first bearish signal shows the momentum of the movement continues in a downtrend. The following day, bullish signals spot at the same level and indicate support levels.
The candlesticks with the same low at the bottom signals strength. It also indicates that the downtrend may be reversing in favor of an uptrend. Bulls came into action and increased the price because of this. When the bullish candle forms, it means that the bullish reversal already occurred yesterday.

Top five tips to learn how to trade effectively
If one thing we’d have to advise you is to improve your trading patterns. It simply means getting out of old strategies, tricks, and tactics. Explore the new trading era and not just explore, implement them as much as you can. Tweezer top and bottom pattern trading contain an entire trading world inside.
Most candlestick pattern improved strategies can work very well, but they cannot be implemented at a suitable market time frame. Therefore, there must be numerous reasons behind it. This article will help you know the hidden techniques of the Tweezer top and bottom candlestick patterns.
Tip 1. Focus on volume and change the pattern
While studying any price chart, we have access to that data that briefs how a market moves. But we never thought about what the force behind it was. However, after watching the volume pattern, we agree that the result could be better.
Why does this happen?
These things happen because we don’t have a suitable volume setting in the price chart. Volume needs to be changed depending on the market movement. Sometimes high volume works better in the field and sometimes low.
How to avoid this mistake?
You need to backtest your trading to know the best time frame and appropriate volume action. There are a few cases we brought for you:
- The volume of this bar is more significant or lower than that of the previous bar. Although it may seem like the simplest condition you could come up with, it’s surprisingly effective.
- Highest/lowest volume x bars back. A more robust version of the filter above.
These two strategies are more effective than each other. Many traders have tested them, and they worked 10x times better than previous. Your analysis will be enriched with information that you did not have previously. By adding more volume to your trading, you will access more data. By measuring volume, you know how the market moved and the conviction that caused it.
Tip 2. Look at the seasonality
Having data, plans, technical analysis, strategies, and techniques but not knowing the suitable time frame’s prediction. Many markets have researched their seasonal tendencies before trading based on daily, monthly, hourly, and yearly.
Why does this happen?
Predictions are essential, and seasonality before starting trading is valuable. Most traders are taking huge benefits by just predicting the next move accurately.
How to avoid this mistake?
We will start looking for a Tweezer top pattern if we know that the market will likely turn bearish by the end. As then, the market will be highly based on the Tweezer top.
It is crucial to consider the effects of seasonality when analyzing stocks from a fundamental point of view because it can significantly impact an investor’s profits and portfolio.
Tip 3. Oversold and overbought conditions
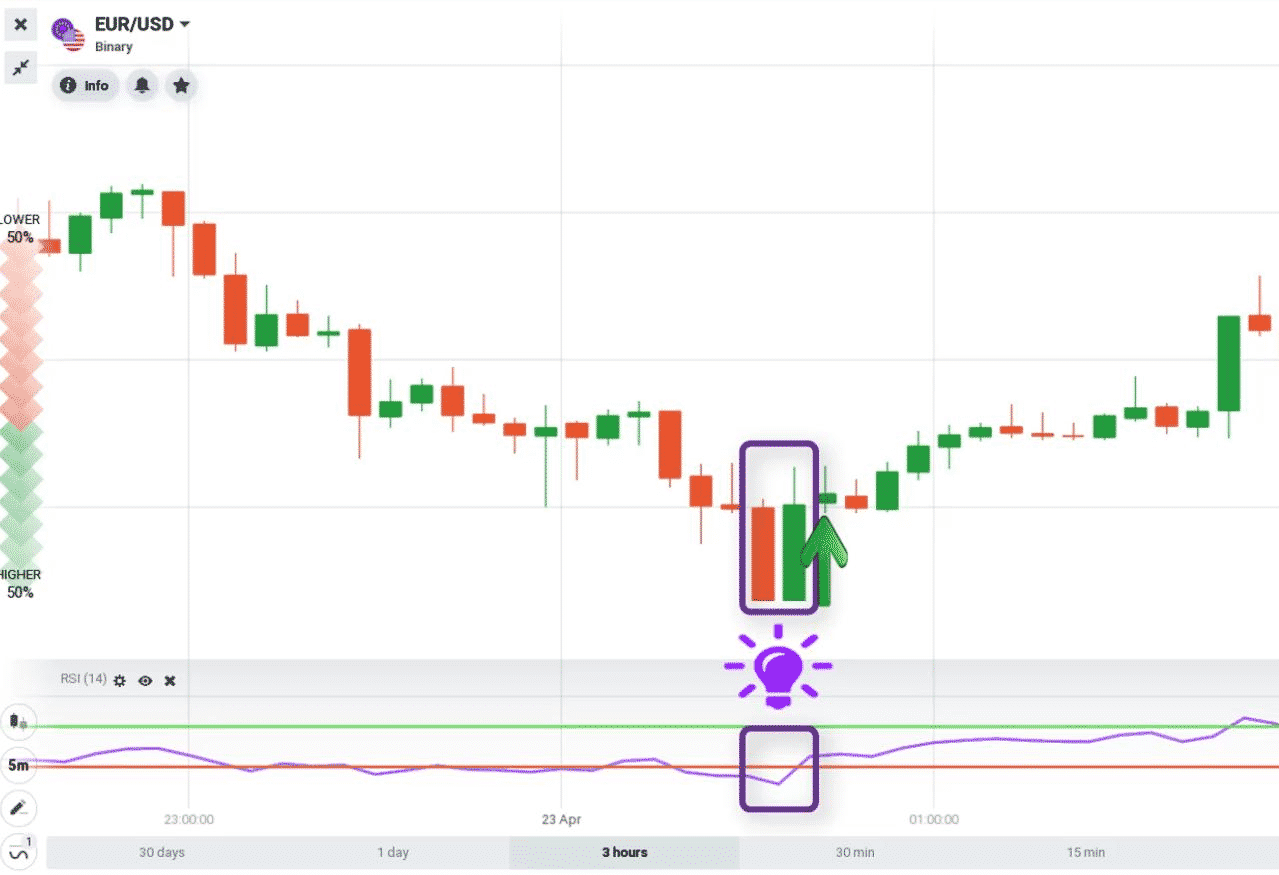
This tip is specifically for the Tweezer top. Traders often use momentum indicators to know whether the market is oversold or overbought. It works better when the condition is likely to be overbought since Tweezers are reversal signals. But how would we trade specifically if we were confused between oversold and overbought?

Why does this happen?
Tweezers are reversal signals that are why momentum indicators work better in overbought conditions. Markets that have moved too much upwards or downwards are usually oversold or overbought.
How to avoid this mistake?
Firstly, it’s not a mistake. These conditions are faced regularly by many traders. But you should know about the readings of momentum indicators to identify whether the market will be oversold or overbought.
While using the RSI indicator, a reading higher than 70 is considered a sign of an overbought market, and below 30 identifies the market is in an oversold condition.
Similarly, in the stochastic indicator, readings lower than 20 and more than 80 are considered oversold and overbought, respectively.
Tip 4. Confirmation before placing the trade
In a hurry, when the market started turning around, traders eventually started placing the trade on the Tweezer top. Unfortunately, this mistake always lets them face big hurdles.
Why does this happen?
Most traders place the trades without confirming the trade setup. And if the market closes above the low of the pattern range, they unexpectedly get a great loss.
How to avoid this mistake?
Before placing any trade, you should confirm these two things must:
- There is a Tweezer top.
- And the market closes below the low of the pattern range.
Tip 5. Strategy of the Tweezer bottom with a range condition
To build a new strategy, we can look at the anatomy of the trading pattern. While trading with the pattern, defending the previous price level. So wouldn’t it be interesting to know how the market reacts around that specific level?
Why does this happen?
When the candles making up the pattern have long lower wicks, the Tweezer bottom symbolizes bullish strength and the ability to defend the previous low.
How to avoid this mistake?
To use this impactful strategy, follow these rules:
- There must be a Tweezer bottom.
- All the candles comprise the pattern close in the upper half of the candle’s range.
Final thoughts
This article has gone through impactful strategies and tips to learn how to build an effective trading pattern.
However, before we end, we want to emphasize the importance of backtesting all trading strategies before going live. Many traders neglect to do this, and as a result, lose money.


