The MACD is a potent indicator because of the number of signals it can provide and the effectiveness of the trade signals. In this article, we will review the essential signals provided by the MACD indicator and present to you the two types of MACD divergence and how to trade them.
Traditional ways to trade MACD
There are three conventional ways to get signals from MACD. That is what you are going to learn in this section. You will also get to know how to qualify the signals to enter high-probability trades.
№ 1. Line crossover
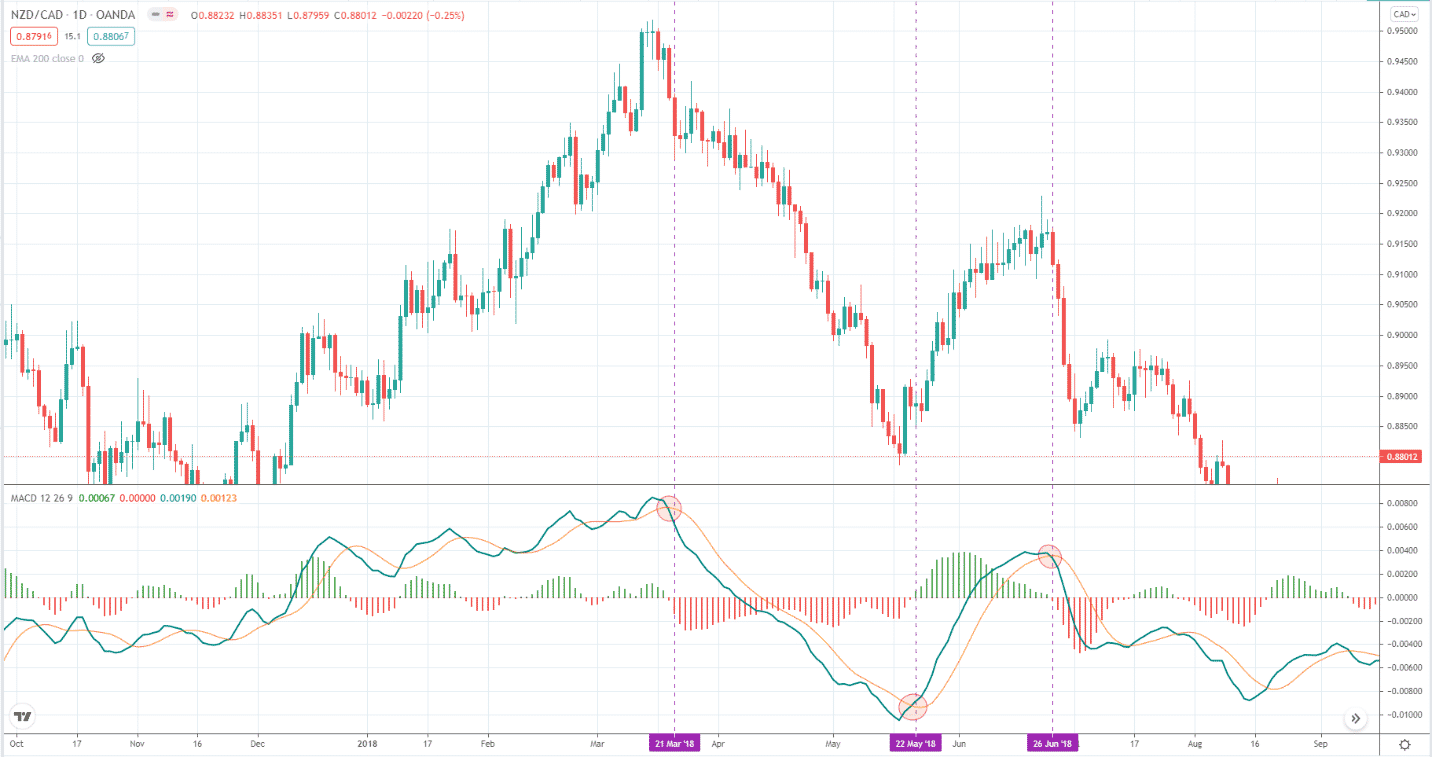
Every time the two lines cross, the MACD gives you a trade signal. However, that is the classic signal given by MACD. Not all signals will, of course, lead to profitable trades. It is not practical or beneficial to take all the signals. Therefore, you must qualify them with other tools or by the MACD itself.
One way to qualify with MACD is the location of the signal. If the signal occurs too far away from the zero line, that is more probable than one taking place near the zero line. This is because the asset being traded could be overbought or oversold when the line crossover occurs at a significant distance from the zero line.
Consider the above daily NZD/CAD chart. Only the first two crossovers qualify as a high-probability trade signal based on the requirement we discussed above. The challenge with MACD is that it does not define a specific upper and lower limit compared to other oscillators such as RSI and stochastic. Thus, your judgment about the overbought or oversold condition would be subjective.
№ 2. Zero crossover
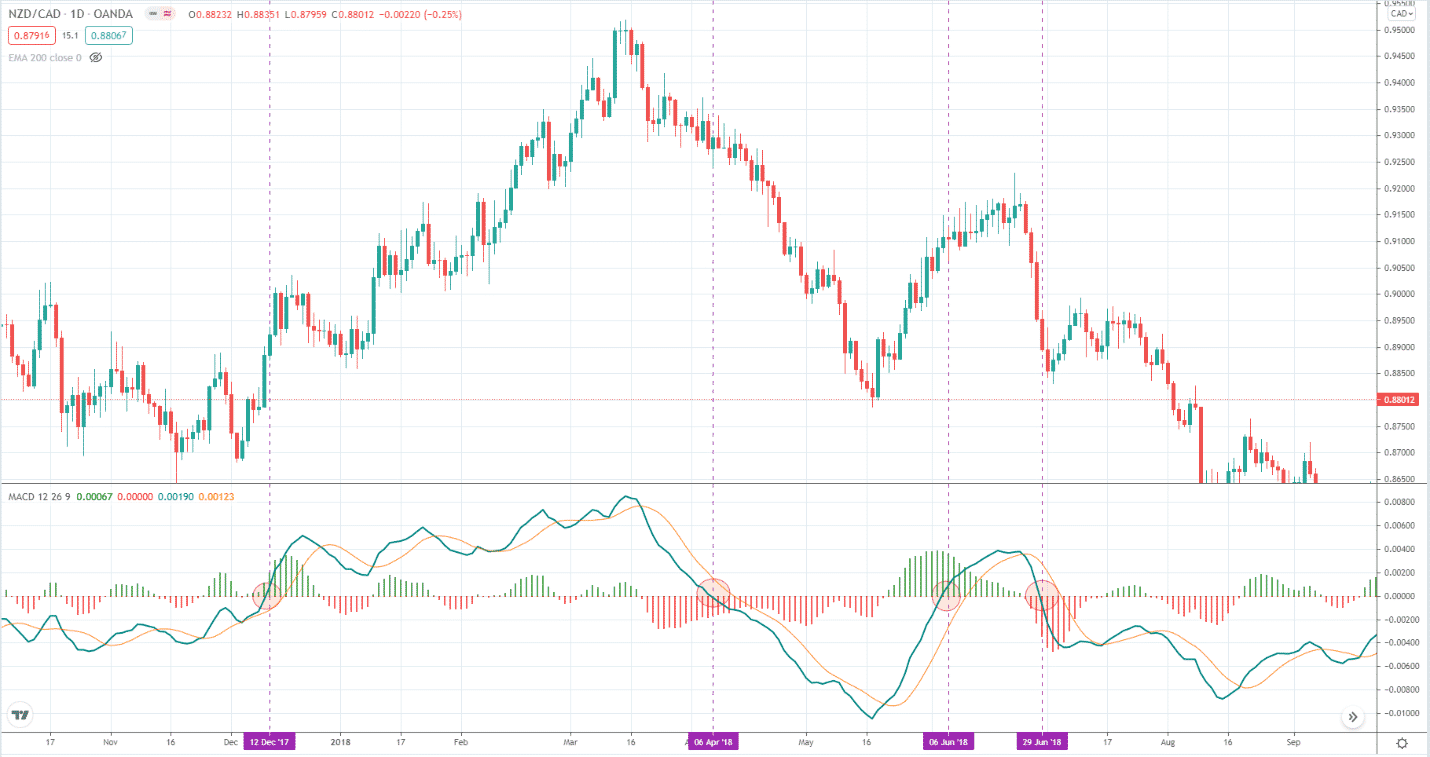
Another MACD trade signal is zero crossover. Since MACD reflects the action of two moving averages (MA) (12 and 26 by default) on the chart, the zero crossover marks the event when the two MAs cross each other. Therefore, the zero crossover of the MACD line is a basic setup.
Many traders use this signal to confirm entries provided by other tools or systems. This is one of the most effective ways to use MACD in trading. To trade the zero crossover signal successfully without using different tools, you can look at the current swing where the zero crossover occurs. If the crossover occurs close to the beginning of a swing, that is a tradable setup. If the crossover occurs in the middle of a swing, the price has already moved some distance. Thus you might be entering at the end of that swing.
Consider the above chart, where you can see four instances where the MACD line crosses the zero line.
- The first two instances are good entries because the swing has just started.
- The third crossover is not good because the price has moved too far from the beginning of the upswing. The same is true for the fourth crossover.
- The fourth signal is not good because it is very close to the previous swing low, and you might see a double bottom.
If you are anticipating a breakout, that is not a good idea since the price did not break the swing low yet.
№ 3. Divergence
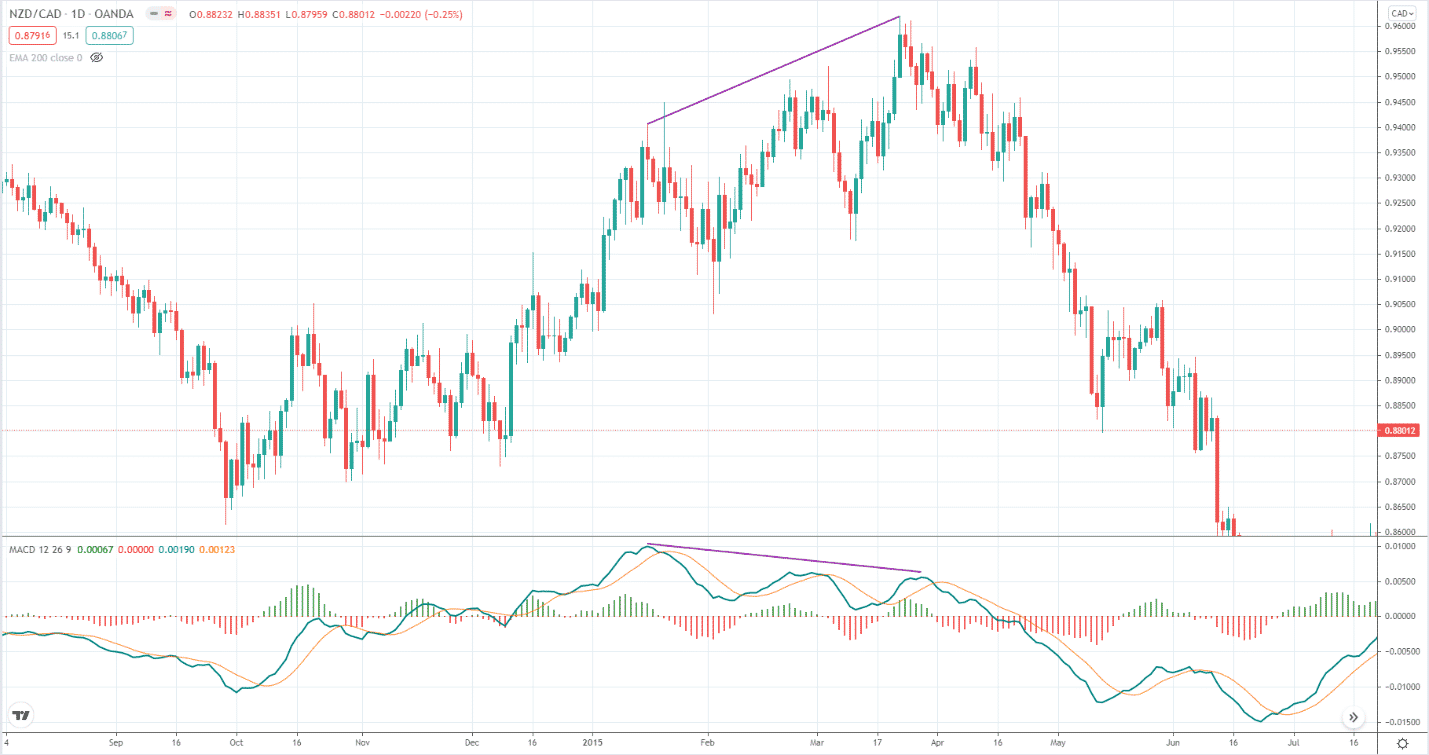
Trading divergence is arguably one of the best uses of MACD. When the divergence is significant and noticeable like that shown in the chart above, the chance for reversal is very high. It is like looking at a crystal ball and seeing the future. This is why MACD belongs to the class of momentum oscillators. It can pick tops and bottoms with great precision. Although the price may not reverse immediately, it will come very soon.
Tradable MACD divergences
There are two types of MACD divergence you can trade profitably. The above section discussed the first MACD divergence. Shortly, we will cover the second type of divergence.
№ 1. Line divergence
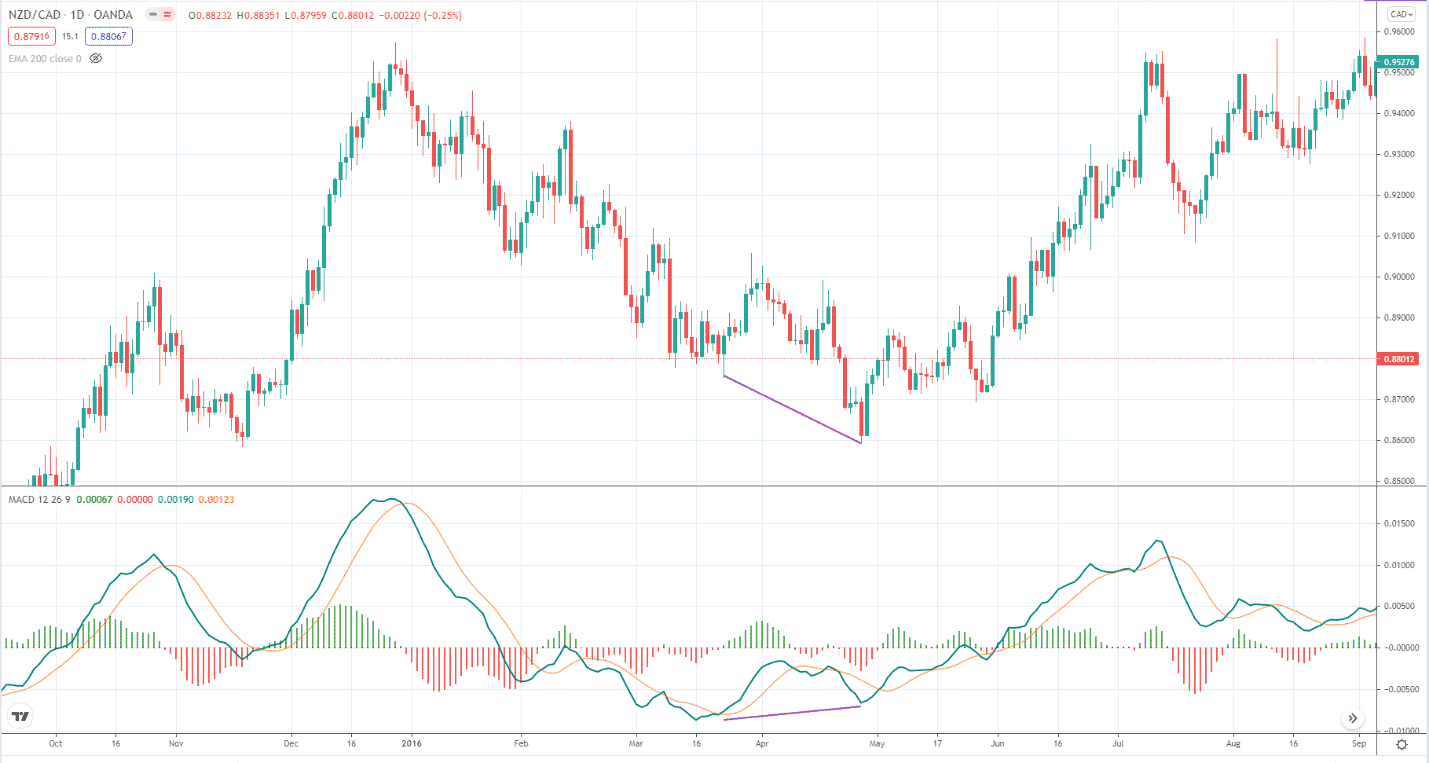
Line divergence is equivalent to classic divergence, meaning the divergence provided by the MACD mainline and the signal line. This happens when MACD disagrees with price action. When looking at line divergence, we must consider at least two swings.
- If the price makes a higher high on the second swing, but the MACD line prints a lower high, a bearish divergence has occurred, and you can trade short.
- If price makes a lower low on the second swing, but the MACD line registers a higher low, a bullish divergence has taken place, and you can trade long.
You can see a bullish divergence in the above chart.
№ 2. Histogram divergence
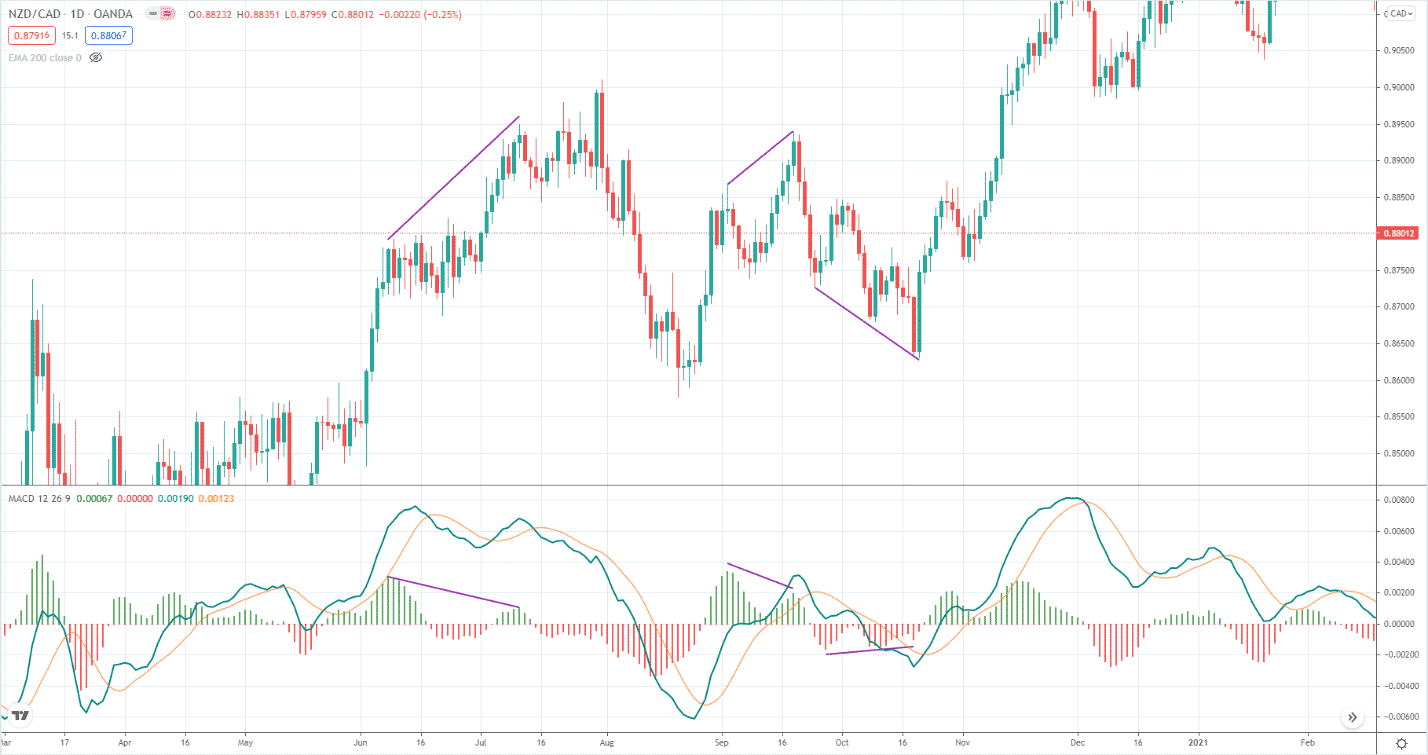
Histogram divergence is not a familiar divergence or trade signal provided by MACD. Not many traders know about this. If you only use MACD and are looking for line divergence signals, you must have missed out on many trading opportunities. That is because histogram divergence is equally powerful as line MACD divergence.
Consider the chart above. In quick succession, three histogram divergences occurred. The first instance coincides with a bearish line divergence. Meanwhile, we cannot see line divergence in the second instance of histogram divergence. Still, the price broke down after seeing the histogram divergence. The same is true for the third instance, which shows bullish histogram divergence combined with a bullish three-drive pattern.
How to trade histogram divergence
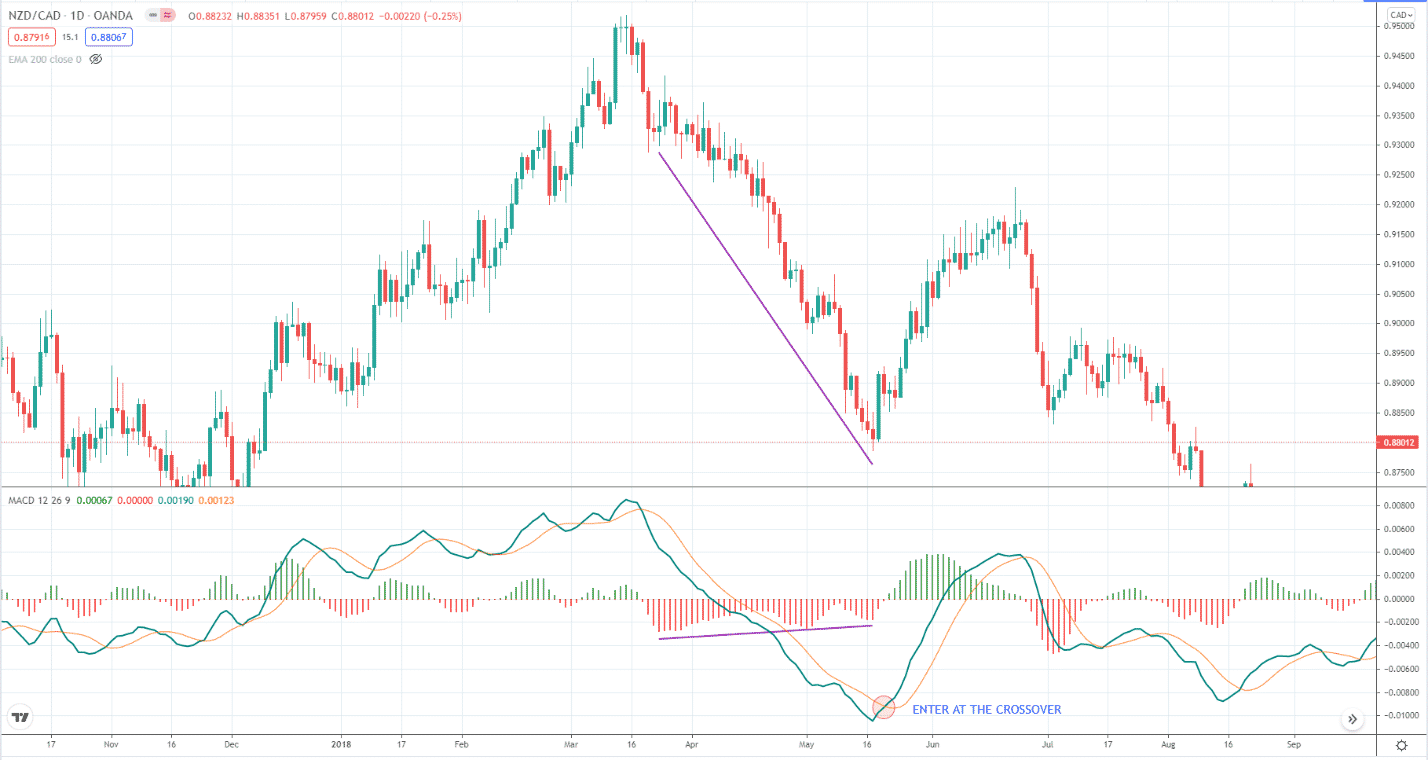
You can find tradable histogram divergences in this way. Just monitor the histogram when the price moves in one direction. Sometimes price moves in a straight line, and at other times it oscillates up and down. The above chart shows the first scenario. Here you can see that the price is moving down.
If you have not checked the histogram, you could not have figured out that price is losing momentum as it goes down. Typically, you will see histogram divergence first before you get the entry signal. Your entry signal comes when the mainline crosses with the signal line, as shown above.
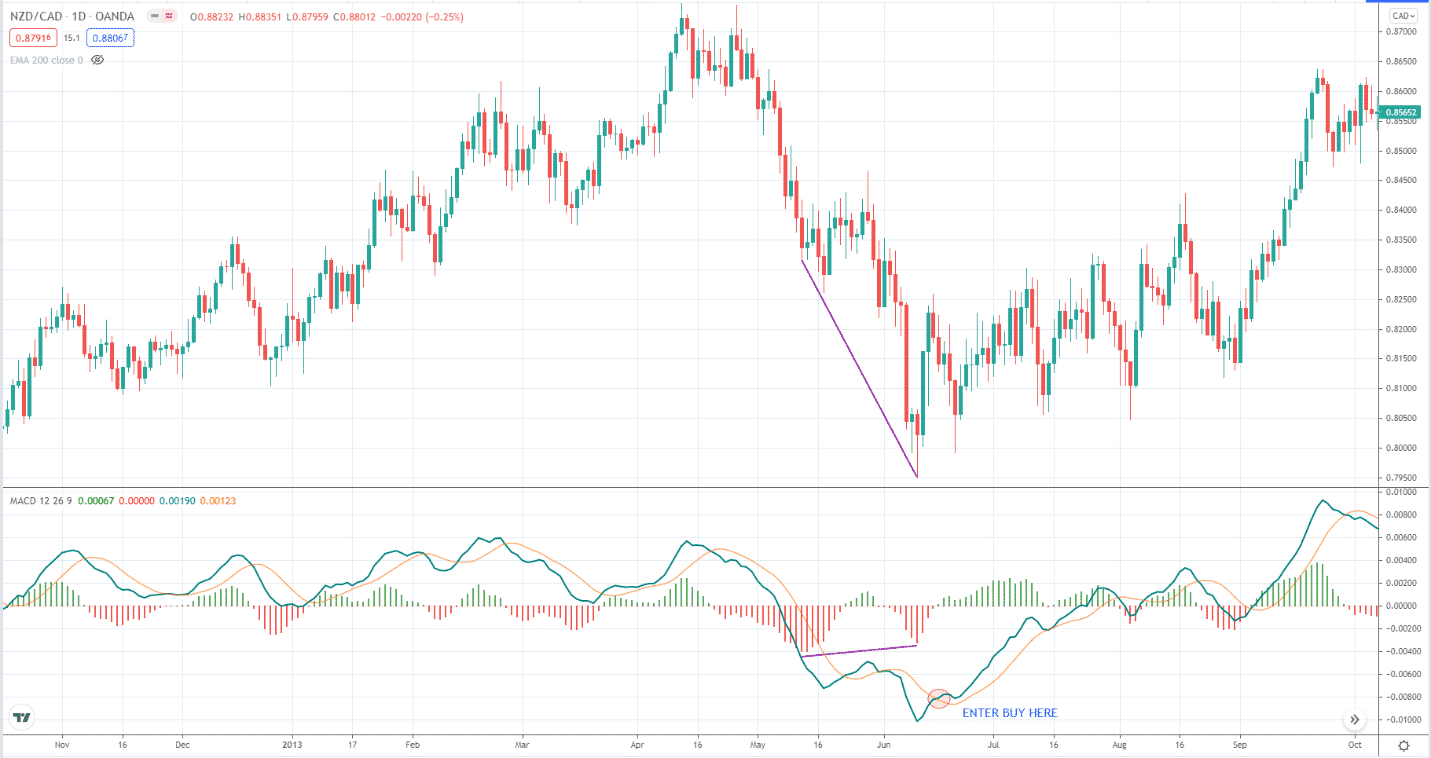
The above chart depicts the second scenario mentioned in the preceding paragraph. Here we see a clear oscillation as price moves down. If you are familiar with chart patterns, the price created a big bullish AB=CD. Then a bullish histogram divergence occurred on the two downswings. Your entry came to a few candles later when a line crossover occurs, as you can see above.
Final thoughts
This article presents the effectiveness of the MACD as a trading tool. It can provide multiple signals you can trade. We have also explained how to trade the two types of MACD divergence:
- While the first type is widespread.
- The second type is not.
In this article, you have seen the power of histogram divergence. Use the ideas you learned here when trading the powerful MACD indicator.


