The market volatility index or VIX is a familiar tool to financial investors for measuring volatility while making trade decisions. It is a valuable technical indicator that investors can use to generate trade ideas and reduce risks. So no wonder this concept of measuring volatility is attractive to crypto investors when using it effectively.
However, when using any technical concept for successful trading, it is mandatory to understand the indicator components and follow specific procedures. In the following section, we will discuss the VIX MTF momentum indicator and describe the top five tips to use this technical concept for efficient trading.
What is the VIX indicator?
The VIX indicator measures the volatility and reflects the market context. This indicator results in an independent window containing histogram bars of different colors on both sides of a central line.
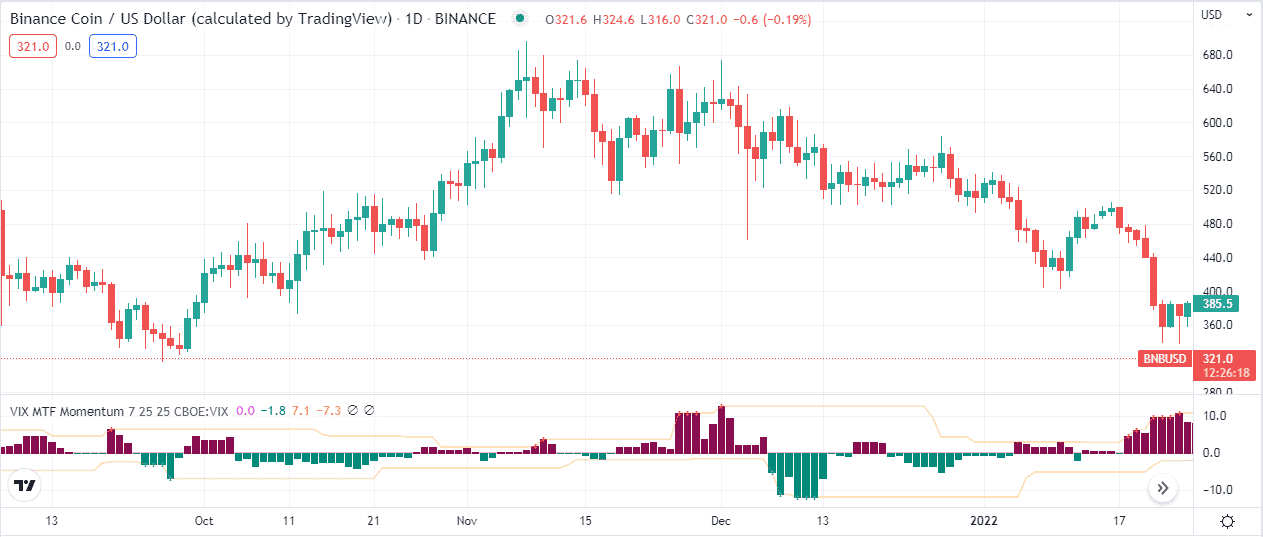
The size of histogram bars changes according to buying/selling pressures on the asset price. Any reading above the central (zero) line reflects participants’ fear, so the price usually declines in this phase. Moreover, when participants gain confidence in any specific asset, the histogram bars flip on the downside and turn green.
Top five tips for using the VIX trading strategy
Using any technical concept to make trade decisions requires following specific guidelines to obtain the best results. This section will list the top five professional tips for effectively using the VIX indicator.
Tip 1. When entering a buy trade
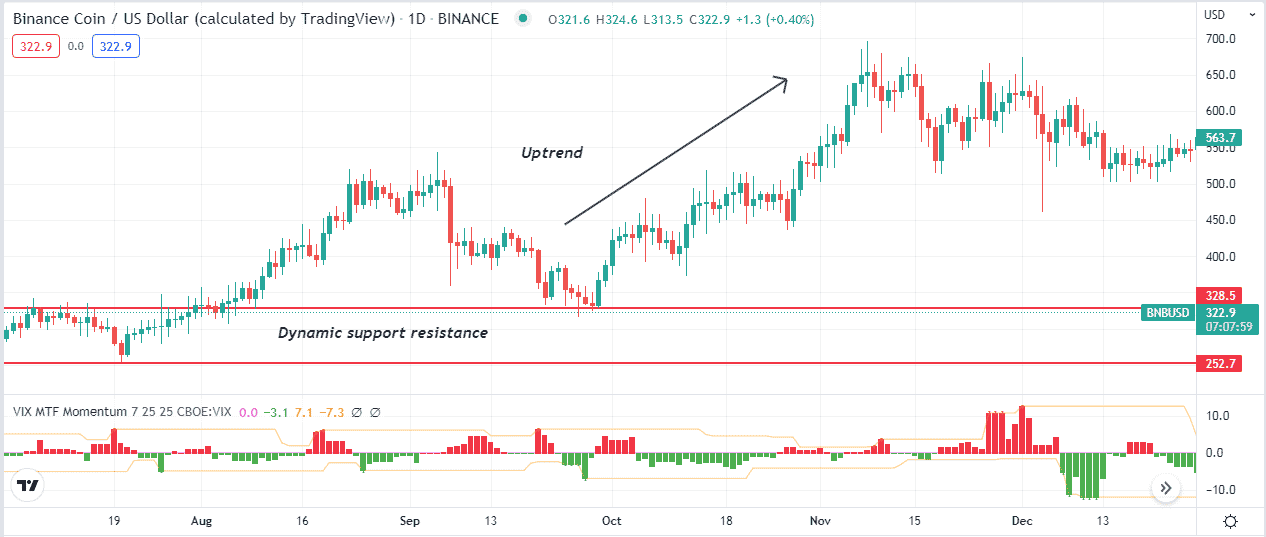
Financial investors who use the VIX indicator seek to open buy positions when the price reaches any support level or exceeds any resistance. For example, the price goes near any support level and bounces upside. Meanwhile, the VIX indicator starts creating green bars below the central (zero) line; it declares potential buying opportunities.
Why does this happen?
The price reaches near the support level, and the support remains valid as the price starts bouncing upside. Meanwhile, the VIX indicator detects increasing buy volume and reflects participants’ confidence through green histogram bars below the central line. The scenario will be the opposite when opening short positions.
How to avoid mistakes?
It is not acceptable to enter trades without proper analysis and strategy. It is better to follow appropriate trade and money management rules when using the VIX indicator, and this indicator only considers the volume info while ignoring other vital technical factors.
Tip 2. When entering a sell trade
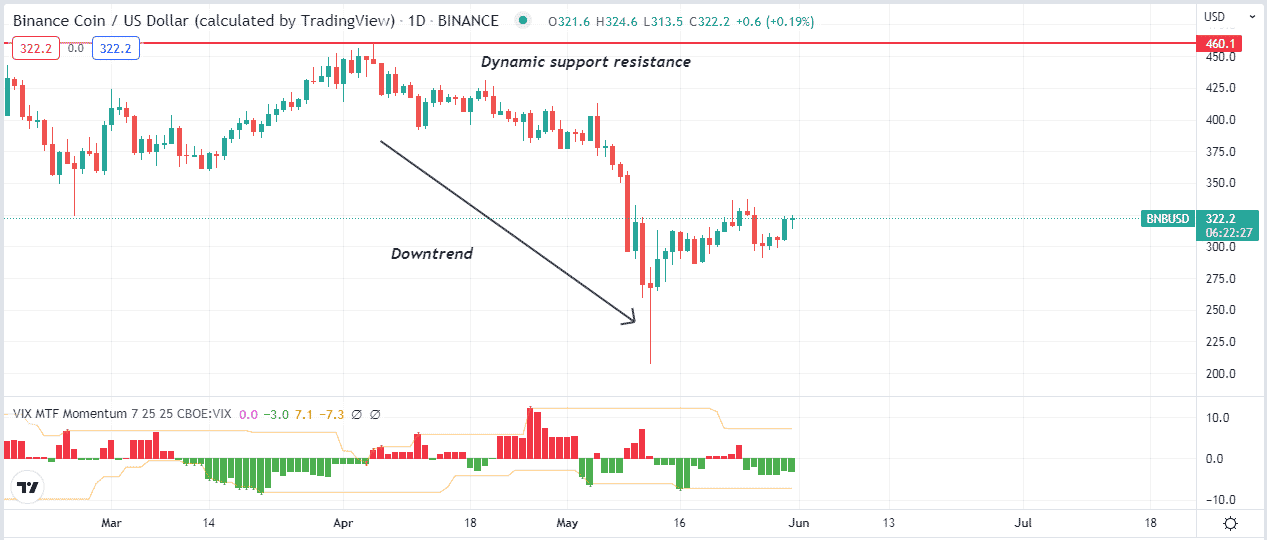
Financial investors can use the VIX indicator to execute sell trades successfully. In this case, seek to open a position when the price reaches near any resistance level or breaks below any support level. For example, the price goes to any resistance level and declines. Meanwhile, the VIX indicator creates red histogram bars above the central (zero) line suggesting opening a sell position.
Why does this happen?
When the price reaches any resistance level and starts to decline, the resistance is valid. Meanwhile, the red histogram bars on the VIX indicator window declare increasing fear of participants, so the price starts to decline.
How to avoid mistakes?
The initial profit-taking level will be above the next support level when opening sell positions using this concept. If the price breaks below that support level, you can continue your sell position. We suggest shifting the stop loss at or below the break-even point when the price creates a new lower low.
Tip 3. Detect sideways
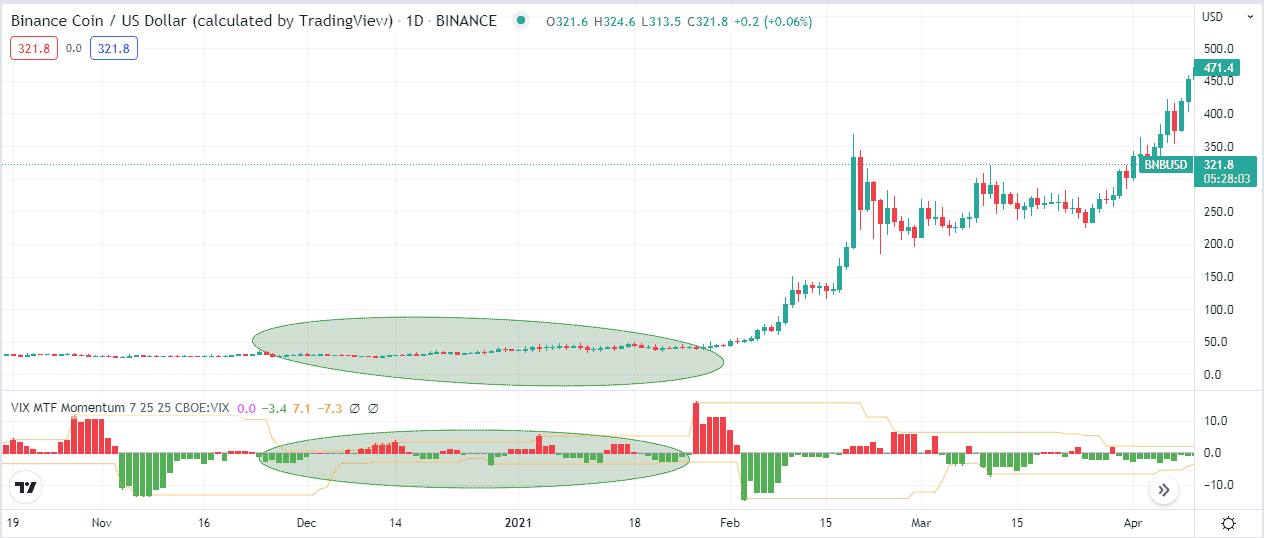
The VIX indicator helps determine sideways, and detecting sideways is essential when trading financial assets as it enables participation in potentially profitable trades. When the histogram bars become smaller and have different colors, bars frequently take place on both sides of the central line.
Why does this happen?
As overall volume decreases and frequent buy/sell occurs due to regular transactions. So the size of histogram bars gets smaller due to decreasing volume.
How to avoid mistakes?
It is common among financial investors to detect sideways to participate in more potential trades. Usually, the volume decreases, or after consolidation there, a significant movement occurs. Expert investors wait for breakouts and execute trades according to the current trend direction.
Tip 4. Determine breakouts for trade opportunities
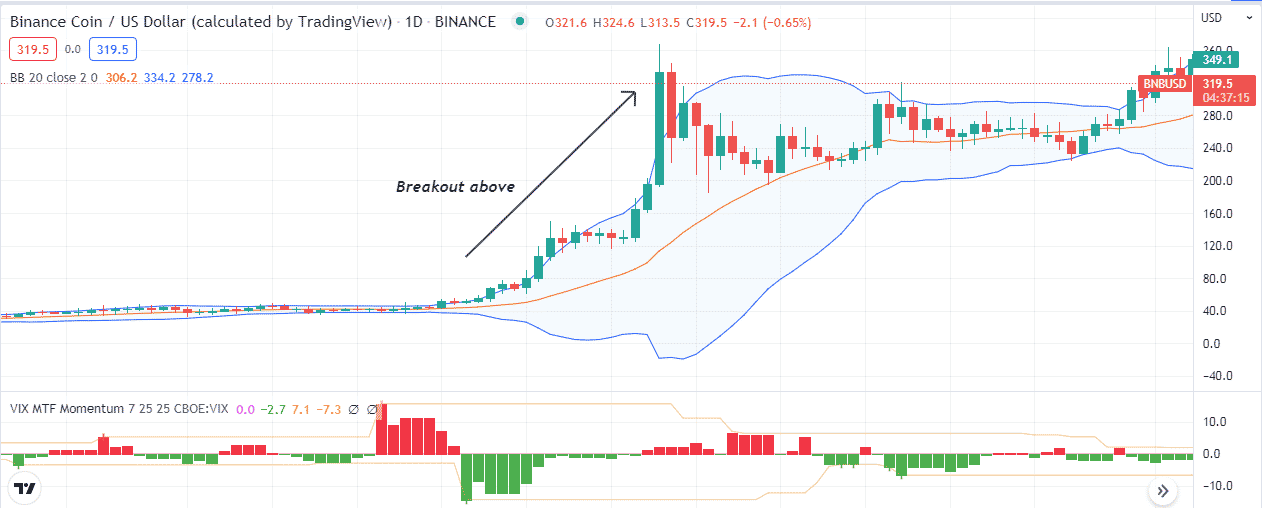
Identifying breakout levels is essential as it enables participating in swing trades. You can use the VIX indicator to determine breakouts. For example, you can use the Bollinger Bands indicator alongside the VIX indicator to detect breakout levels. When the VIX indicator creates green histogram bars below the central line and price candles move on the upper channel of the BB indicator and continue moving by touching the upper band declared breakout above.
Why does this happen?
The price remains sideways, and the sudden buy pressure increases, so the participants start gaining confidence as the green histogram bars appear at the VIX indicator window. Meanwhile, the Bollinger Bands indicator confirms the breakout.
How to avoid mistakes?
We suggest not entering any trades before confirming the breakouts. Moreover, cryptocurrencies are volatile assets, so better set tight stop loss when opening any position. Again conduct a multi-timeframe analysis to ensure the actual trend before executing trades.
Tip 5. Combining the RSI indicator
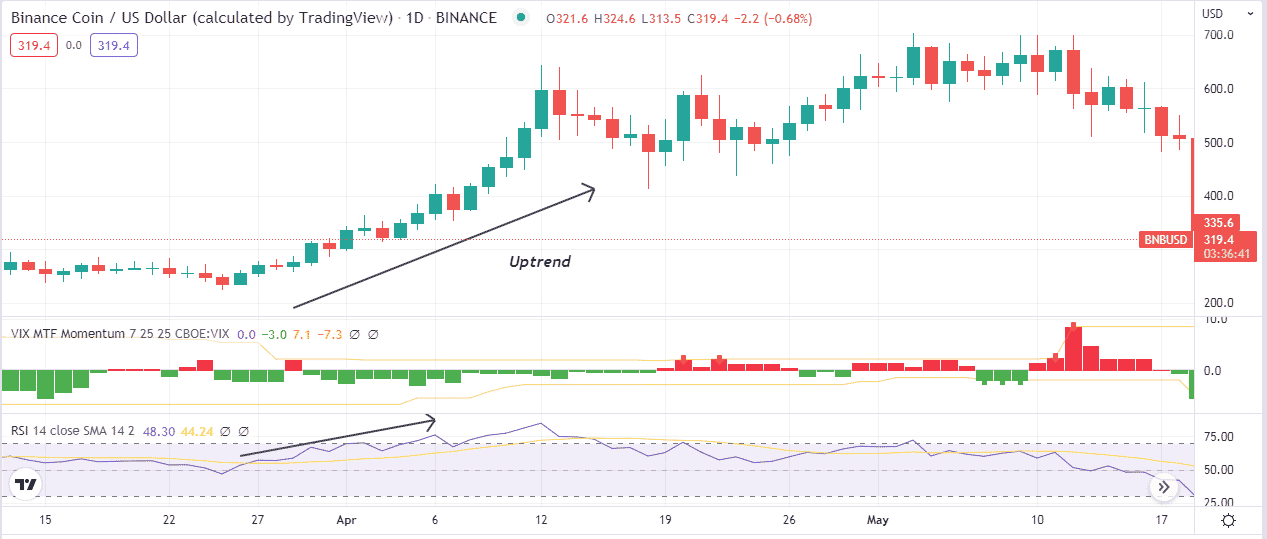
You can use other technical indicators or tools to generate trade ideas. For example, you can combine the RSI indicator reading with the VIX indicator to make trade decisions. Suppose the VIX indicator creates green histogram bars below the central line, and the RSI dynamic line remains near the mid-level. Start move upside declares positive pressure and vice versa.
How does this happen?
Defining trends and executing successful trades becomes easier when both indicators declare any price direction.
How to avoid mistakes?
When using two or more technical indicators to create any trading strategy, combine all readings carefully and match all conditions before entering trades. Using tight stop loss for existing trades limits your loss when the market goes against your order.
Final thought
Finally, this article introduces a most potent technical indicator capable of generating consistently profitable trade ideas. We suggest sufficient practice of these professional tips above to master the concept and use it efficiently.


