Moving averages (MA) are a cornerstone of technical analysis, helping to smooth out short-term price fluctuations and highlight long-term trends. While simple moving average (SMA) and exponential moving average (EMA) only accept account price data, volume weighted moving average (VWMA) also includes volume data, revealing another critical aspect of technical analysis.
VWMA price data emphasize volume. The VWMA will monitor price more closely on high volume days, and on low volume days, the VWMA will act similarly to a simple moving average.
Let’s take a deep dive into the strategy and how you can master it for FX trading.
What is a VWMA trading strategy?
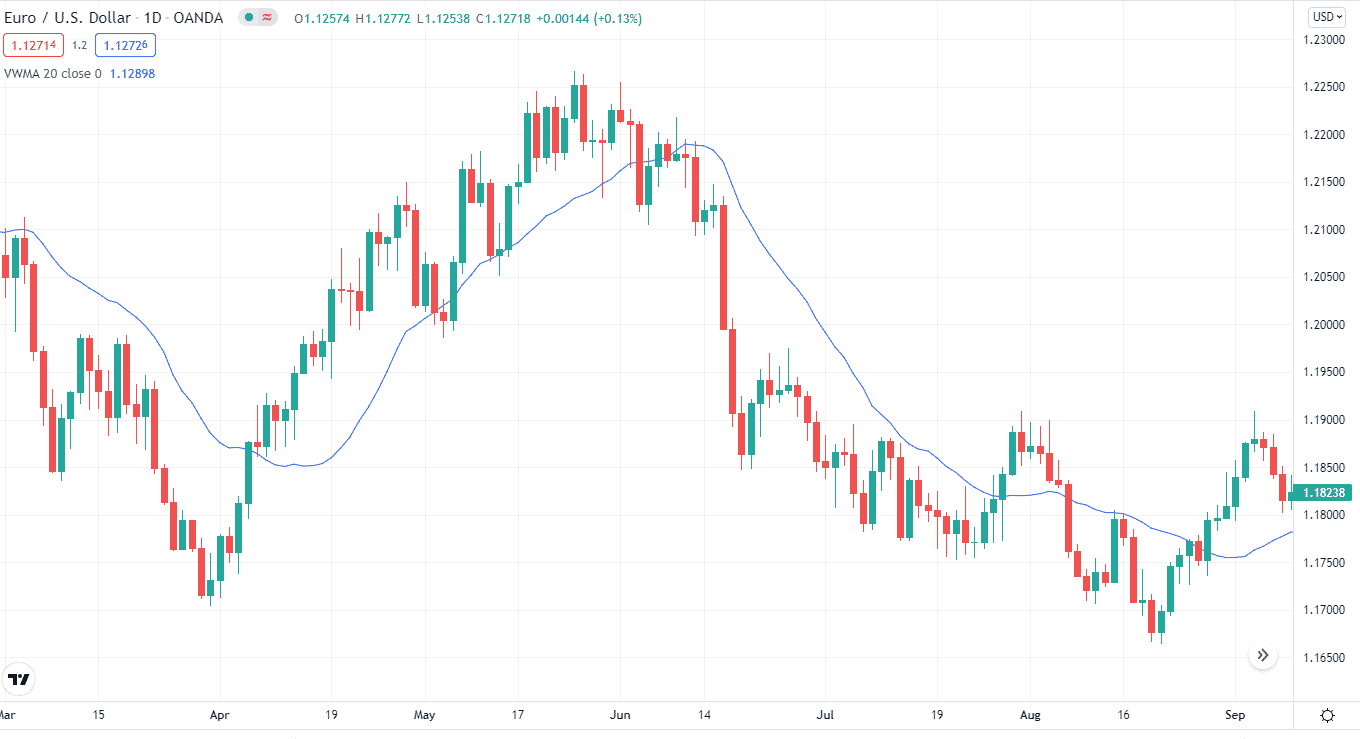
The indicator shows the average price of a currency pair based on weighted volume. The indicator looks identical to MAs, but it works like the SMA. It consists of only one line, like the SMA, with the period representing the market trends. The single line detects the overall market volume and separates it based on its weight.
VWMA calculates the average price at the weighted volume. This detection of weighted volume can help you find support and resistance levels (S&R), thus identifying entry and exit points.
The indicator provides the signals when its single line goes with the trend, hence producing long and short opportunities.

- If the VWMA is pointing downwards, it’s time to go short.
- If the VWMA is going upwards, it’s a good signal topoen the position for buying.
VMWA and VWAP look similar when you apply them to the chart. The VWAP is calculated based on the weighted price, but the indicator has three lines.
Moving volume weighted average price (MVWAP) and VMWA are two distinct indicators. MVWAP is an oscillator, whereas VMWA is a trend indicator. The latter is determined by taking a forex pair’s weighted average price and adding volume.
How to trade?
The indicator emphasizes the weighted volume through average price. This calculation helps it to identify levels of S&R. These levels tell you when to enter or exit the trade.
The indicator produces signals when the line moves upwards or downwards.
- It’s a good buy signal when the indicator’s line moves up.
- On the other hand, when the VWAP moves down, it signals to go short.
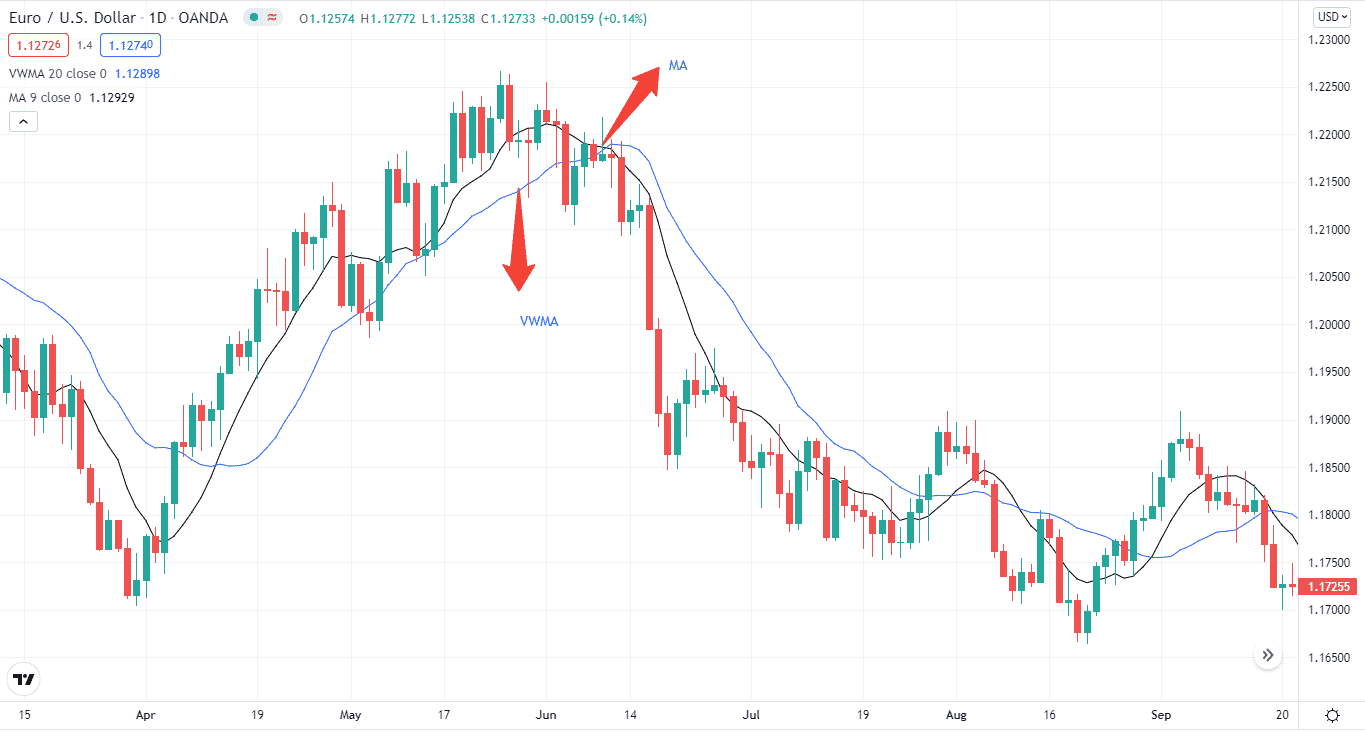
You can also apply other MAs with the indicator to detect a crossover between a longer and a shorter MA.
- It’s a buy signal when the longer MA goes above the shorter one.
- When the shorter one goes above the longer one, it’s a sell signal.
Let’s check that VWMA has a 20-period while the MA has 9. The trend starts to dip when the 9-period MA crosses above the 20-period VWMA.

Bullish trade setup
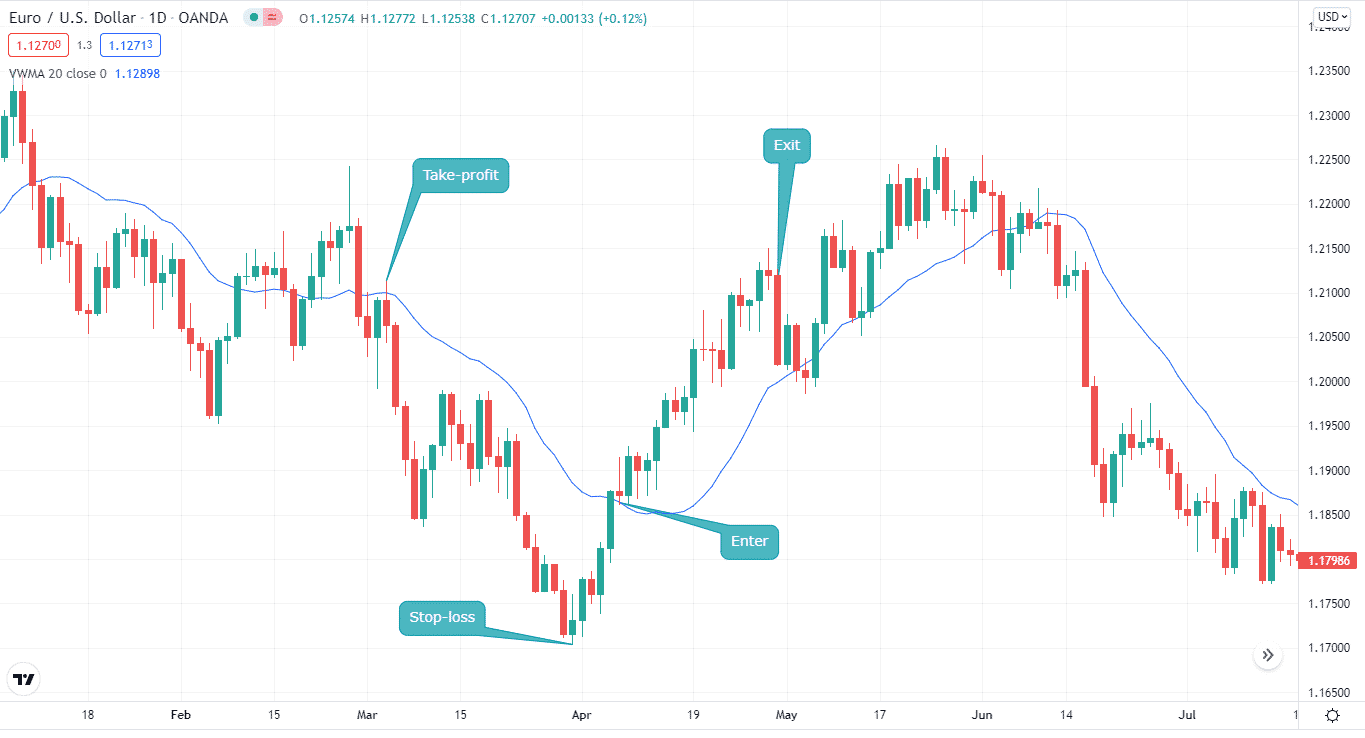
Like any other MA, the bullish trade setup is quite simple. First, you need to locate that the price move above the VWMA. The trend can make a swift reversal, so it’s important to wait for the trend to continue moving forward.
On the chart below, you can see that the price went above the VWMA. We waited for the trend to continue moving forward. The trend did move upwards, suggesting a bullish setup.

Entry
To go long, you must wait for the trend to continue and then enter at the next candle. You can also enter when the price goes above the VWMA.
Stop-loss
You can set an SL near the recent low.
Take profit
You can set your TP equal to SL or the recent low, depending on your strategy. Our TP hit, and we exited the trade early on.
Bearish trade setup
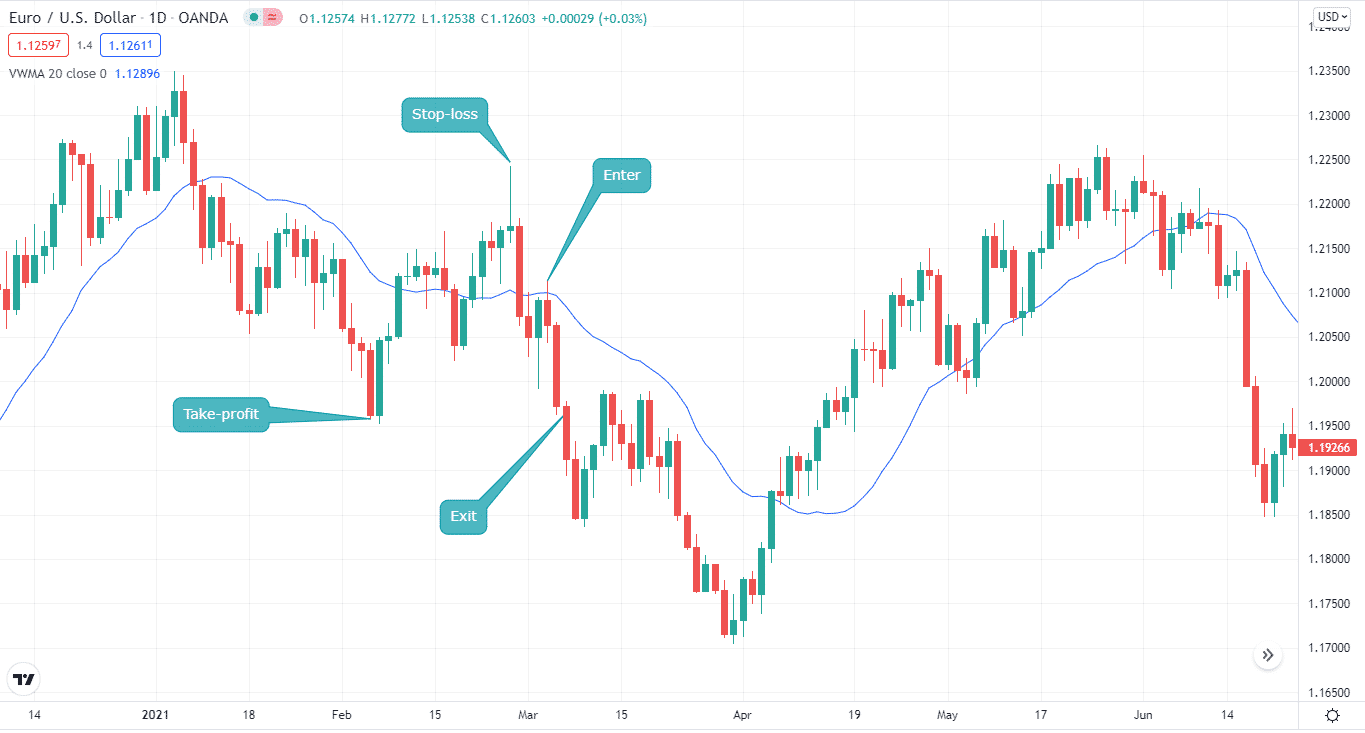
The bearish trade setup of VWMA is opposite to the bullish one. To open the short position, you need to look for a downtrend. The price must slip below the VWMA. You can wait for the trend to continue moving downwards before entering the short trade.
The chart below illustrates a bearish setup for VWMA. You can see we entered the trade when the price slipped below the VWMA. Notice the price did dip earlier but moved upwards quickly. So, it’s best to enter the trade after confirmation.

Enter
To enter the trade, the price must fall below the VWMA. You need to wait for the confirmation to occur before entering the trade.
Stop-loss
You need to look for the recent high from the entering point to place an SL.
Take profit
Depending on your strategy, you can set your TP equal to SL or the recent low. Our TP hit, and we exited the trade early on.
How to manage risks?
Like any other MA, VWMA is a lagging indicator. It adds volume for its calculation, and when the volume increase, volatility increase also. So, it’s best to come up with a solid risk management plan before entering the trade.
Some of the ways to manage risks using the indicator:
- Stop-loss
You ask any trader about an SL, and the market participant will tell you its importance in forex risk management. You can place it near the recent high when entering short trades and at the recent low when going long using the VWMA indicator.
- Time frame
With the indicator, you can use any time frame. However, the indicator produces fewer false signals or whipsaws on longer time frames. If you are a scalper or an intra-day trader, you can look for trends on longer time frames and then use the shorter time frame for taking a position.
- Other indicators
As we mentioned earlier, you can also use other MAs or other technical indicators with the VWMA. It gives you more accurate signals than a single VWMA could do. By using other indicators with VWMA, you cut the risks of entering at the wrong time.
Final thoughts
VWMA is an excellent indicator for finding the direction of the trend. It also tells you entry and exit points. To avoid getting whipsawed, you can also use VWMA with others.


