The price change occurs in the financial market by making many swing points. The Zig Zag pattern determines those swing points, so no wonder financial traders frequently consider this pattern or formation while making trade decisions.
However, every pattern is unique in the FX market and shows the market context differently. So it is mandatory to understand pattern formation to create successful trading methods. This article will introduce you to the Zig Zag pattern and complete trading strategies using this pattern.
What is a Zig Zag pattern strategy?
Before enlightening the strategy, it is mandatory to clear the concept of the Zig Zag pattern. It typically identifies the swing points by reducing the market noise and filtering out smaller price movements. Filtering these points allows observing the whole forest rather than only focusing on a single tree.
The Zig Zag pattern enables traders to determine the exact swing highs and lows on various time frame charts. The Zig Zag indicator is the standard tool for determining these levels. In other words, the technical indicator to identify the exact rising points and depths. This indicator enables setting values for deviation percentage and depth. For example, you set the deviation value to 15.
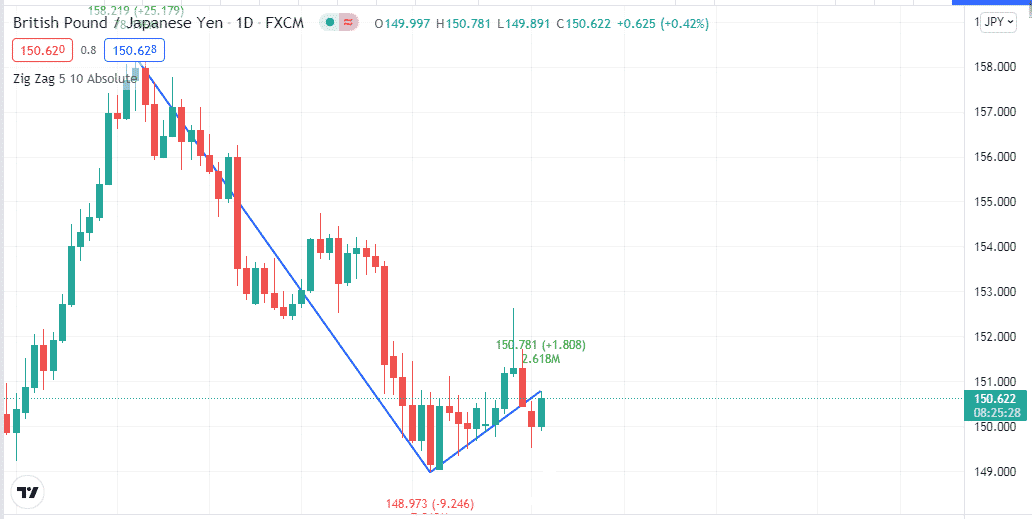
The indicator will show only price movements that are greater than 15%. The indicator only shows results depending on hindsight but cannot predict the future price movements.
How to trade with the Zig Zag pattern strategy?
When it comes to creating an acceptable trading strategy, creating a complete trade setup using the concept is impossible as it only shows the results. Meanwhile, this pattern is helpful in many other ways. The Elliot Wave is a standard technical indicator that generates trade ideas only depending on the Zig Zag pattern concept. You can create invincible trading strategies by combining this concept with other technical tools and indicators.
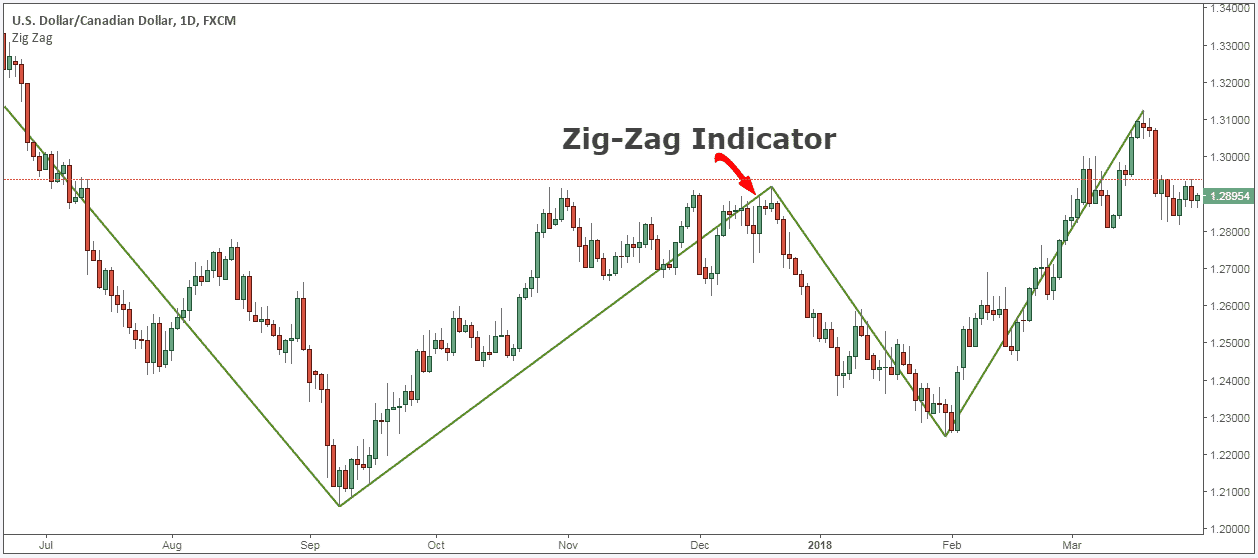
This pattern also supports many price action concepts. For example, look at the chart below. Here, four points are A, B, C, D. AB and CD are bullish movements, and BC is bearish. The AB is similar to the size or range of the CD.
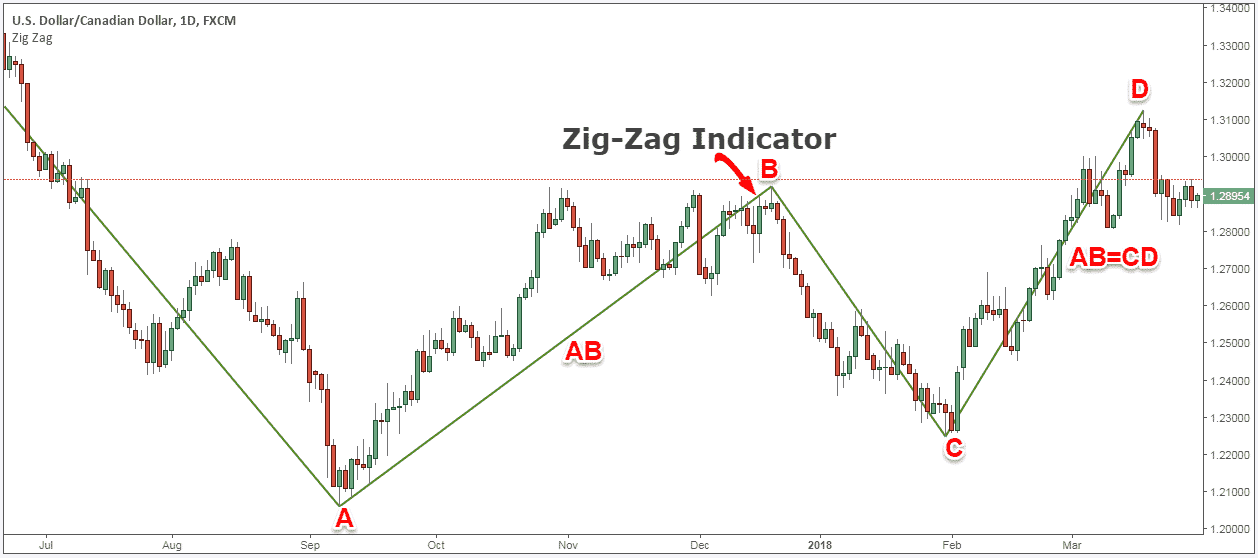
The price action concept supports this idea after a considerable bullish movement. It is typical to have a declining pressure or retracement to a certain level. When the buyers get back again and the price rises, it may reach a similar distance as the previous bullish movement.
We use the Fibonacci retracement tool and the RSI indicator alongside the Zig Zag pattern to determine trading positions in our trading method.
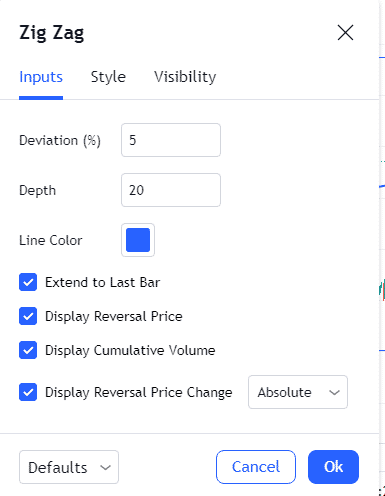
We use the deviation value five and depth of 20 for the Zig Zag indicator. Meanwhile, the most effective reversal levels are 50%-80% of the Fibonacci retracement tool.
Bullish trade setup
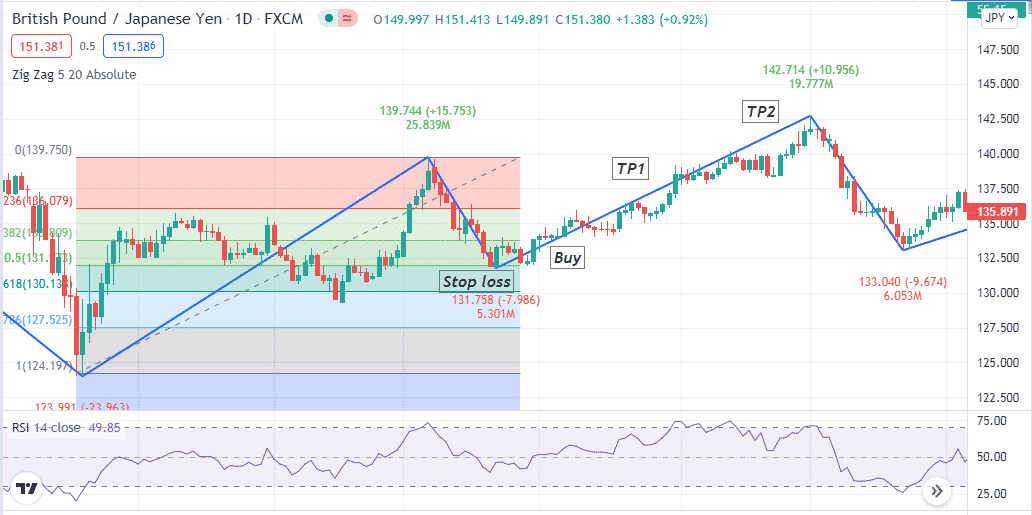
When seeking to open a buy position using this trading method, seek a complete bullish momentum and set the Fibonacci tool from that high to the low when the price starts to decline and observe.
- The price enters the reversal zone of the Fibonacci retracement tool and starts to bounce on the upside.
- The RSI line is above or at the central (50) line and sloping on the upside.
Entry
When your target asset chart matches these conditions above, it declares a potential upcoming bullish momentum. Open a buy position here.
Stop loss
The reasonable stop loss level for the buy order will be below the current swing low of the bullish momentum.
Take profit
The initial profit target will be near the previous high. It is common that the price makes more upside than that last high and creates another higher high. In that case, close the buy position when the RSI line reaches at the upper (70) level or start sloping on the downside after reaching that level.
Bearish trade setup
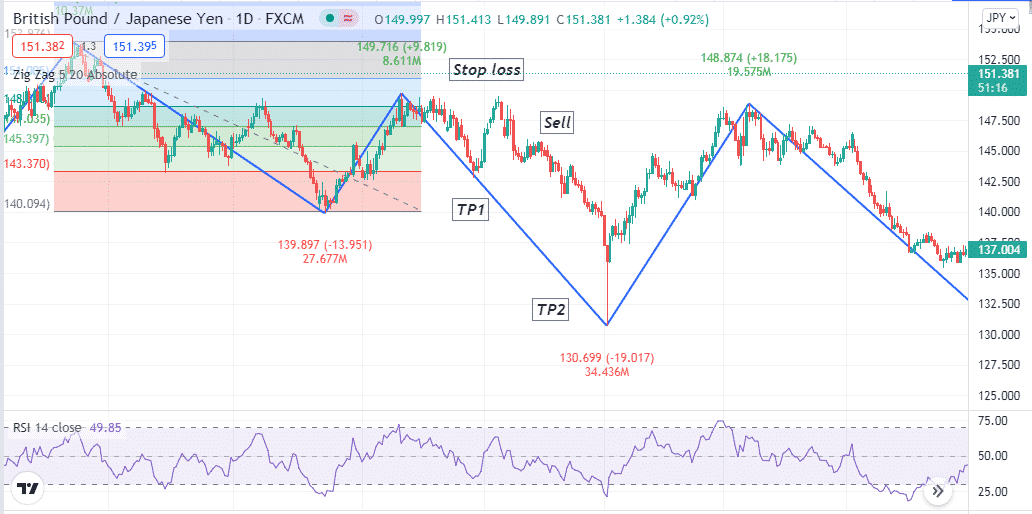
Seek to open a sell position through this trading method when the price starts to bounce back on the upside after making a lower low. Set the Fibonacci retracement tool to the range of previous bearish momentum, from the high to the low and observe when:
- The price enters at the reversal zone of the Fibonacci retracement tool and starts to decline again.
- The RSI line is below or at the central (50) line and slopes on the downside.
Entry
When these conditions above match your target asset chart, it signals a possible upcoming bearish momentum. Open a sell position here.
Stop loss
The reasonable stop loss level for your sell order will be above the current swing high.
Take profit
The initial profit target will be near the previous low. It is common that the price makes more downside than that previous low and creates another lower low. In that case, close the sell position when the RSI line reaches the lower (30) level or start sloping on the upside after reaching that level.
How to manage risks?
It is mandatory to follow risk management to trade using any trading method. The top risk management tips for this trading method are:
- Check on fundamental data of participating currencies while executing trades using this method. Avoid trading using this method during any major fundamental economic news release.
- If you use short-term time frames, it is wise to check on upper time frame charts to determine the current trend before opening any trading position. It will increase your profitability to enter trades in the direction of long-term trends.
- Using a multi-time frame analysis will increase your profitability and reduce risks.
- Use proper stop loss and don’t enter the market before the reversal occurs. So avoid early entries, check on the RSI window and the Fibonacci retracement tool carefully.
Final thought
The Zig Zag pattern has an excellent winning ratio. Moreover, it is typical in any financial asset chart such as currency pairs, commodities, cryptocurrencies, stocks, indices, etc. You can use other technical indicators such as MAs, MACD, ADX, etc., to generate potentially profitable trading ideas and create complete trading strategies.


