The crypto crash trading strategy is a unique trading approach that enables investors to determine significant price movements. The crash finder indicator helps investors determine trend and trend switching points. So it makes sense that anyone with the ability to utilize the concept in the crypto market can make a considerable amount of profit.
Many professional investors detect the crash or significant movements using technical indicators and concepts. This article introduces you to the crypto crash concept and the top five tips to participate in trades by implementing the concept correctly at your target asset.
What is the crash finder indicator?
The crash finder indicator is an efficient technical tool to obtain the market context. It collects the market info and calculates it to define the current trend and reversal or opposite force on the asset price. This indicator shows results in an independent window containing a central line and histogram bars on both sides of the central line.
Histogram bars switch above/below price candles according to the price performance of trading instruments. Moreover, it shows oversold and overbought conditions as the indicator starts sloping in a specific direction when a price trend is present.
Top five tips for using the crypto crash trading strategy
This part lists the top five tips for using the crash finder indicator for crypto trading.
Tip 1. When entering a buy trade
When seeking to open a buy position, spot a finish line of a downtrend where the price may start to bounce on the upside. Check the indicator window. When you mark the histogram bar above the central line, it declares a positive force on the asset price. Histogram bars will make a series above the central line, indicating buyers are dominating the asset price.
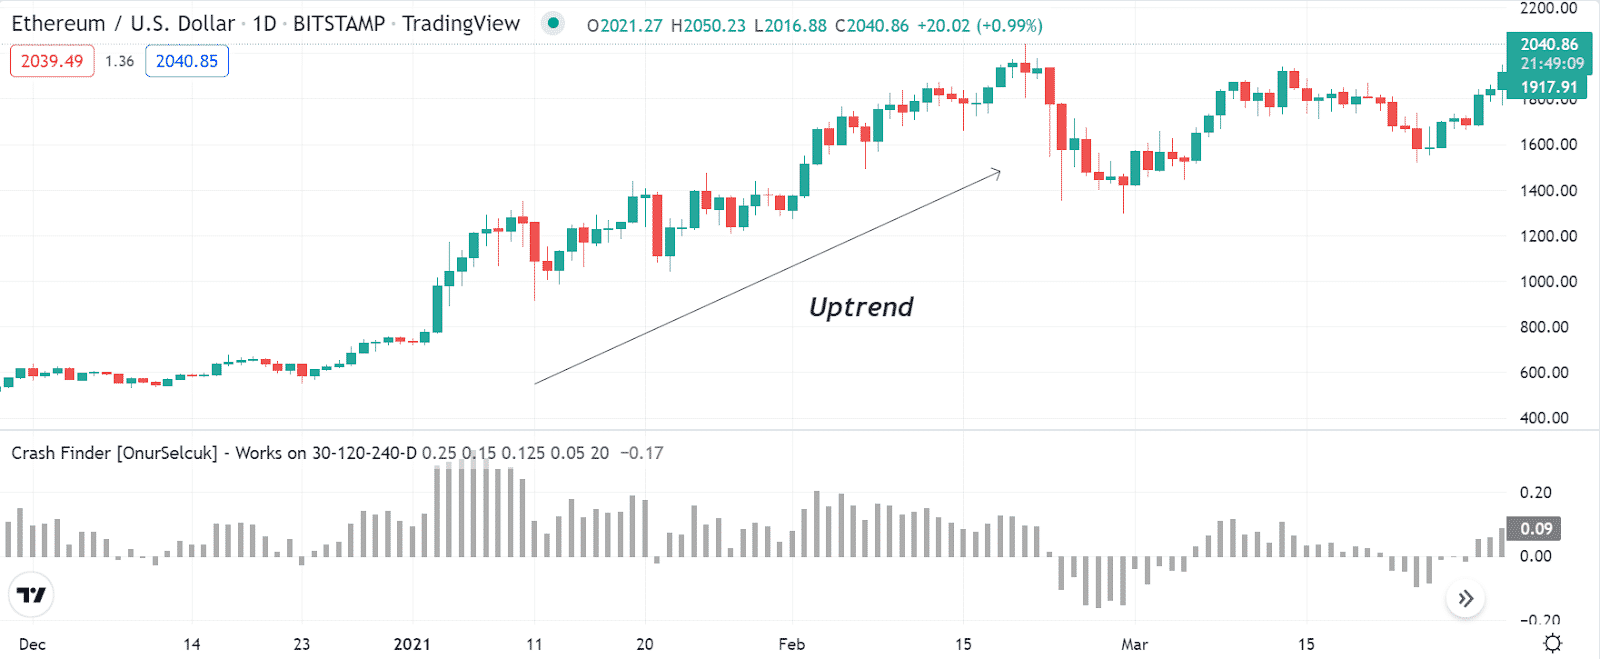
Why does this happen?
It happens as the crash finder indicator calculates the increasing buy/sell pressures on the asset price and shows it in an independent window through histogram bars. The size of histogram bars will change according to the current trend’s strength.
How to avoid mistakes?
When using the crash finder indicator to enter bullish trade, identify the bullish momentum near any support level. Moreover, if you are a short-term trader, check the upper time frame charts to confirm the trend direction before executing any trade. You can combine many other technical tools and indicator readings with this indicator concept to generate helpful trade ideas.
Tip 2. When entering a sell trade
When seeking to open a sell position, spot a finish line of an uptrend where the price may start to decline. Check the indicator window; histogram bars below the central line declare a negative force on the asset price. A series of histogram bars below the central line indicates the price remains on a downtrend.
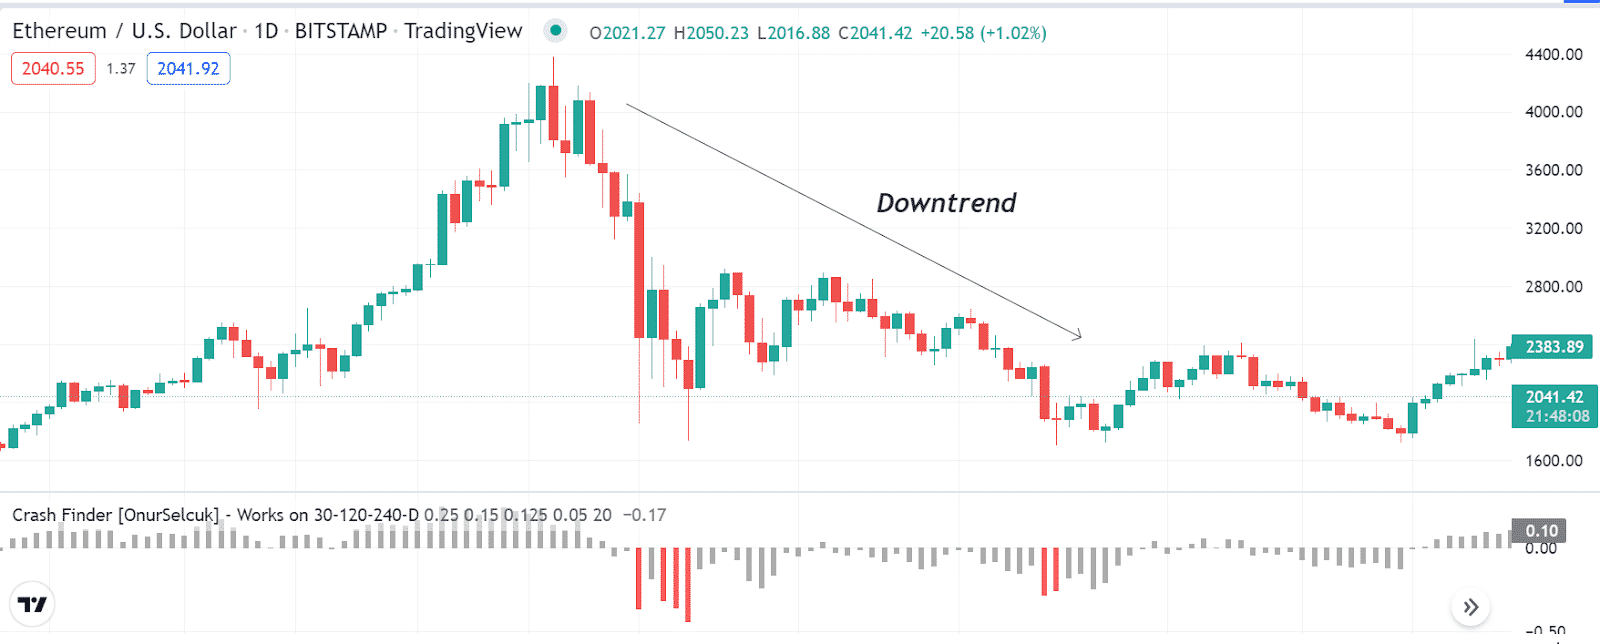
Why does this happen?
The crash finder indicator collects the market info and conducts calculations to determine buy/sell pressure on the asset price. Start creating histogram bars below the central line when it identifies declining or negative price pressure on the asset price.
How to avoid mistakes?
Try to open sell positions below any support resistance level. It will increase your profitability and set a stop loss above the support resistance level to reduce the risk on capital.
Tip 3. Mark sideways
Financial investors usually track the price performance of certain assets to utilize trading opportunities. You can use the crash finder indicator to spot sideways. In this case, histogram bars will frequently appear on both sides of the central line.
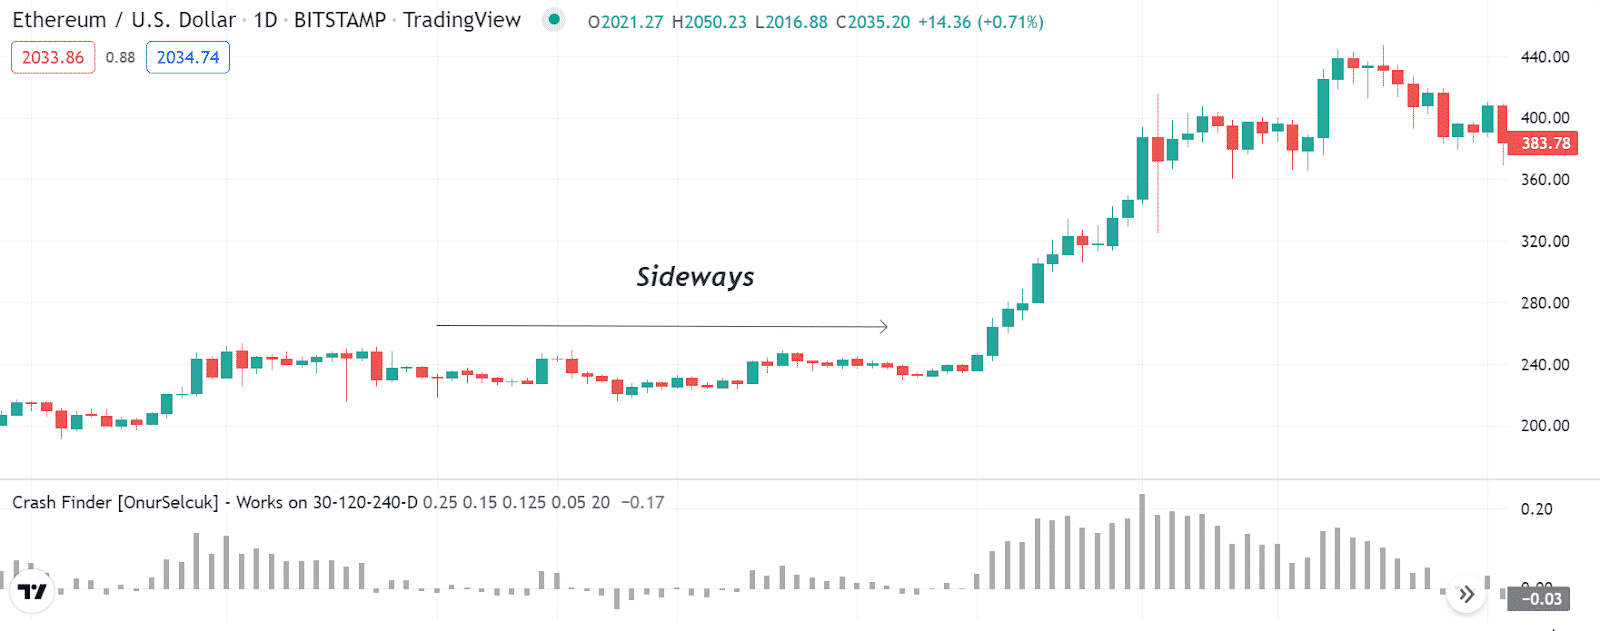
Why does this happen?
As in sideways trading, volume usually reduces, and the price enters a ranging or a consolidation phase. The histogram bars get generally smaller in this condition due to decreasing volume. Financial traders usually detect the sideways to seek trade opportunities. The consolidation phases usually declare a pause on the current trend or a reversal as, in most cases, volume decreases or reflects the indecisions of participants.
How to avoid mistakes?
Avoid entering trades when the price remains sideways. You can buy trades near support levels and open sell positions near resistance levels in a range market. Smart traders often track sideways and wait for breakouts to participate in potentially profitable trades.
Tip 4. Detect breakouts
Marking the breakout levels enables participating in swing trades. Swing trades are attractive to financial traders for providing a good risk-reward ratio on trades. You can identify breakouts by combining Bollinger Bands (BB) indicator with the crash finder indicator.
For example, the bands of BB get closer, declaring squeeze momentum; when the price starts to rally, the bands of BB get wider on the upper side. Meanwhile, the crash finder indicator creates a series of histogram bars above the central line, indicating a potential bullish momentum.
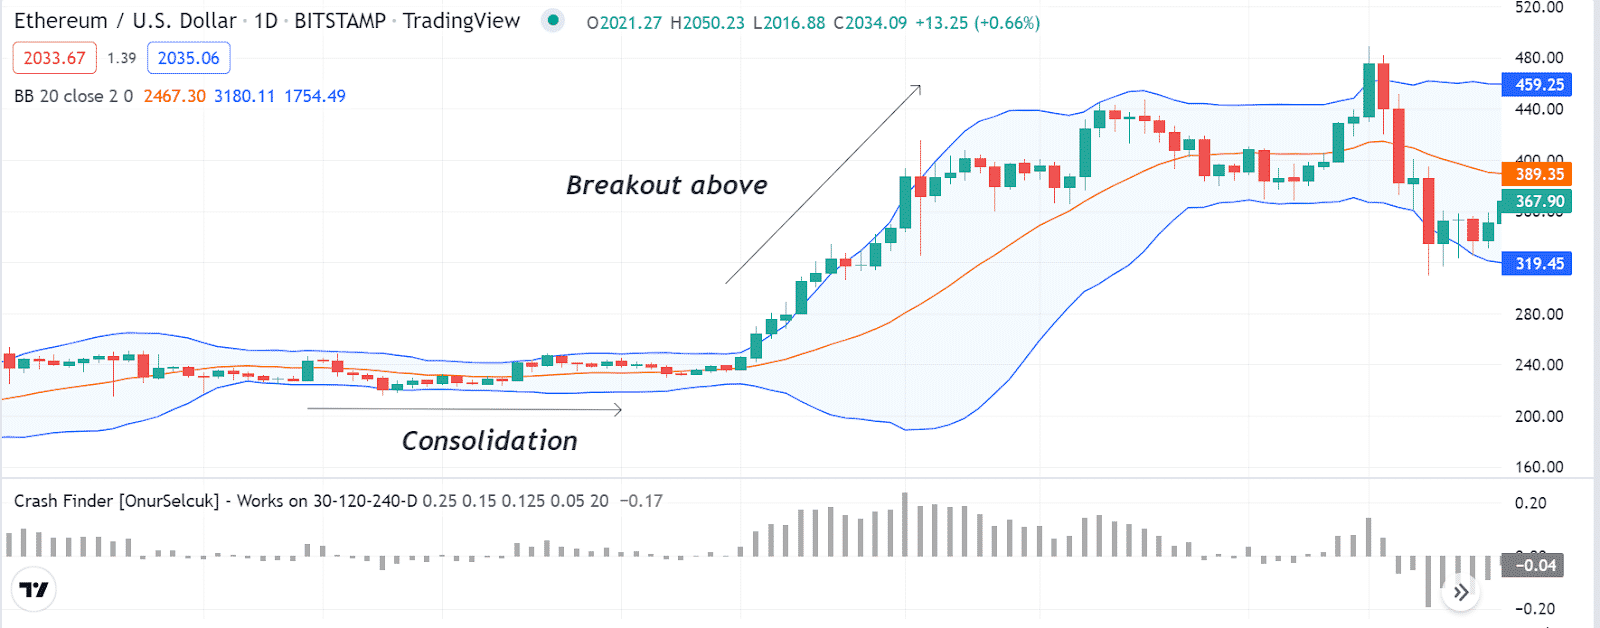
Why does this happen?
Both the BB and crash finder indicator declare a positive force on the asset price after the price remains sideways for a while.
How to avoid mistakes?
Confirm the breakout direction is valid by carefully checking on upper timeframe charts and carefully matching both indicators readings before opening any position. Moreover, set tight stop loss above/below the breakout levels to reduce capital risks.
Tip 5. Combine other indicators
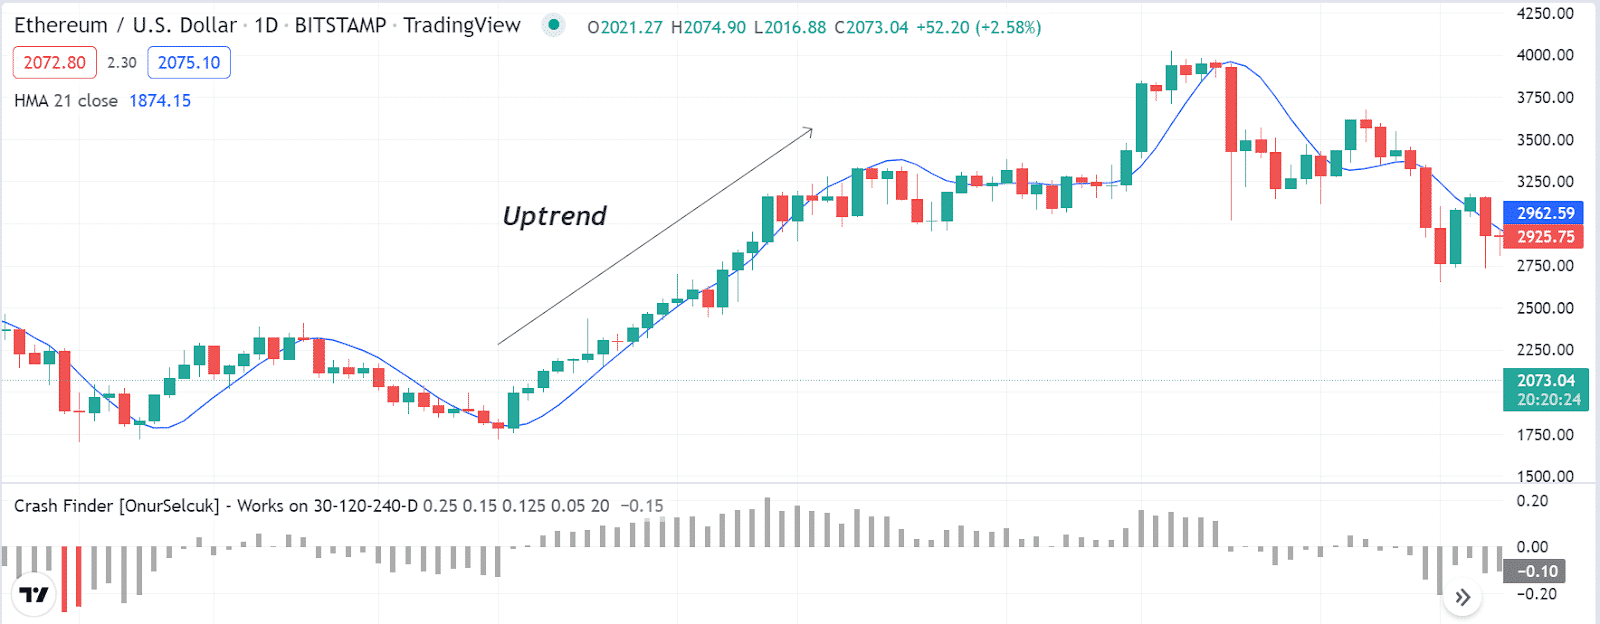
You can combine other technical indicators with crash finder indicator readings to generate trade ideas. For example, you can use an HMA line with the crash finer indicator while making trade decisions in crypto assets. May you use an HMA line of 21 periods. The price reaches above the HMA line and the HMA line slopes on the upside. Meanwhile, the crash finder indicator declares a bullish force on the asset price, and investors may open a buy order.
Why does this happen?
It happens as both indicators suggest the price movement in the same direction. Combining both indicators readings enable trade opportunities for crypto investors.
How to avoid mistakes?
Recheck indicator readings to confirm the price movement before entering trades. Implement proper trade and money management concepts while executing trades by combining two or more indicators.
Final thought
Finally, this article introduces a top potential trading indicator, the crash finder. Using this indicator concept properly, you can make enormous profits from the crypto market.


