There is no doubt that momentum trading is one of the most straightforward crypto trading strategies because it is simply about understanding the market speed and riding the wave.
This is also a hazardous and challenging strategy to master since predictions can go either way. Again, volume is the most critical component. The volume of a trend defines its swiftness.
Traders ride the wave until they hit a specific level and then exit. A vital part of the process is judging the right moment to exit the market according to various indicators and analyzing changes in volumes. Let’s explore more about momentum strategy in crypto coins with some effective tips.
What is a crypto momentum trading strategy?
Investing in momentum can be done both on traditional stock exchanges and with cryptocurrencies. As far as both contexts are concerned, it refers to “underlying trend strength.”
Short-term price movements are the main focus for traders motivated by market volatility. Traders buy assets when uptrends begin and sell coins and tokens when prices peak before falling again. On the other hand, traders follow the “buy high, sell even higher” philosophy.
This skill assumes that an asset’s upward or downward trend will continue after it gains speed. Isaac Newton first established this concept by discovering that moving objects usually remain in motion unless interrupted.
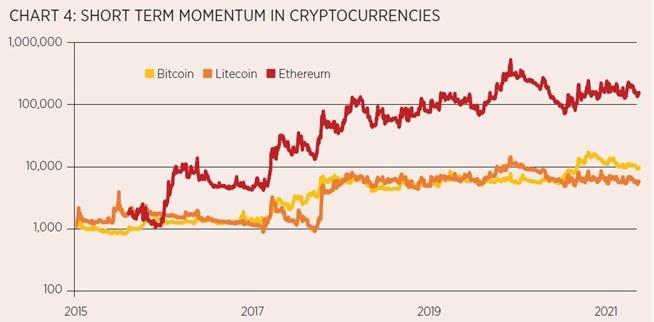
Given the age and nature of cryptocurrencies, the momentum of crypto markets keeps changing in no time. The acceleration characteristics of Bitcoin, Litecoin, and Ethereum appear between 2015 and 2021.
In contrast, it was much less intense for Bitcoin and Litecoin, even if they performed well in Ethereum. As a result, the direction of these two was flat, apart from significant gains during the crypto bull market of 2017.
Since institutional investors are pouring money into the asset class, we might expect mean-reversion to occur, but valuing cryptocurrencies is tricky, so this is unlikely to happen.
Top five tips for trading with crypto trading strategy
Check out a few of the most widely used trading tips.
Tip 1. Use of MACD
The use of MACD with the momentum style has more complexity. This indicator exhibits both trend-following and momentum characteristics.
Why does it happen?
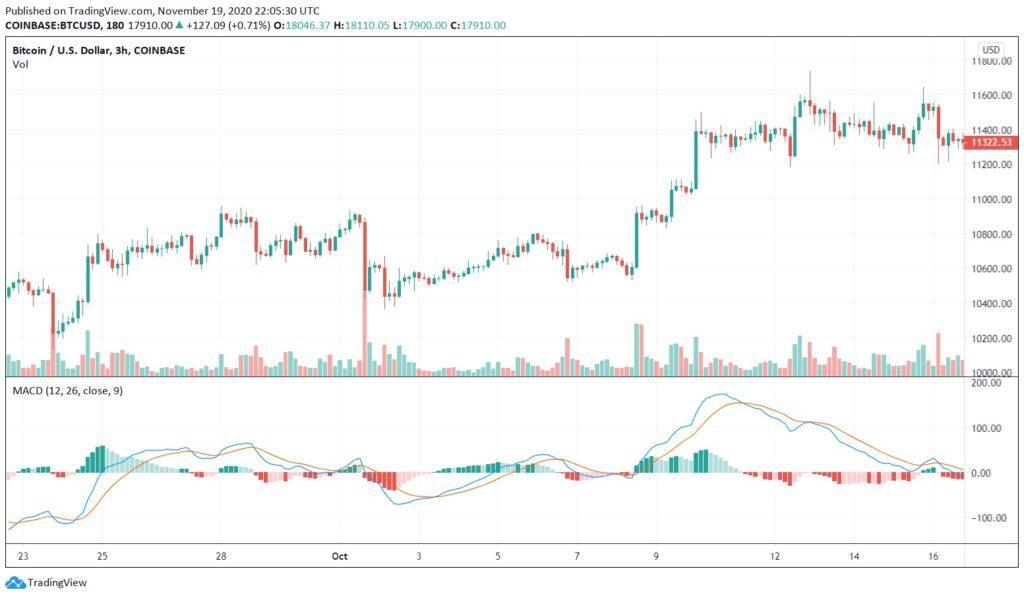
In the MACD, two exponential moving averages (EMAs) merge to produce a result determined by subtracting the 12-period EMA from the 26-period EMA.
How to avoid the mistake?
MACD only uses two EMAs, but the two lines aren’t the EMAs displayed on the chart. As an alternative, one of the lines is the MACD line, and the other is the signal line, which provides signals on whether to buy or sell. A histogram also appears, which shows the difference between the MACD line and the signal line.
It tends to be more robust when the two lines cross, and a trend will continue when the two lines diverge.
Tip 2. Use of breakout patterns
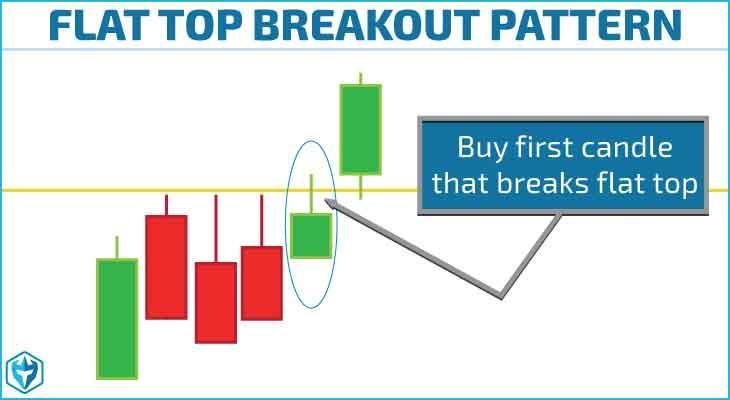
Unlike the bull flag pattern, the flat-top breakout pattern usually has a flat top after the pullback has occurred, as implied by its name. But, again, the obvious balanced top way will help you recognize this over a few candles on a chart.
Why does it happen?
Usually, this pattern occurs when large sellers are present at a certain price level, which requires buyers to buy up all of the shares before prices can continue to rise. A breakout from this pattern can result in an explosive rally since short sellers will place stops just above this level as soon as they see it forming.
How to avoid the mistake?
All the buy stop orders will get triggered when buyers blow through the resistance level, causing the stock to shoot up quickly, giving the longs a nice profit.
Tip 3. Use of ADX
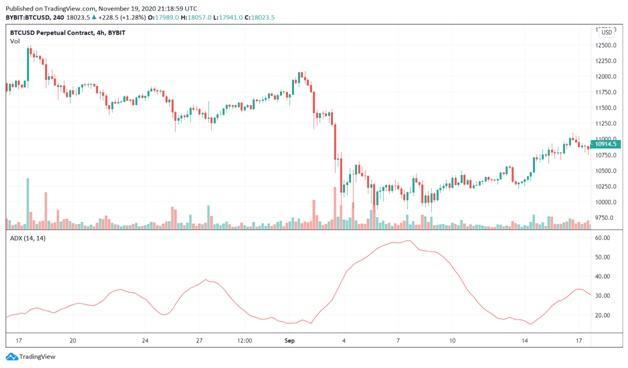
The average directional index (ADX) is a popular and straightforward indicator used to determine trend strength. It aims to determine an asset to make a more informed decision.
Why does it happen?
ADX is an oscillator that analyzes price trends using sophisticated math calculations. A trend line that fluctuates between 0 and 100 helps to illustrate the strength of a price trend. In technical terms, a reading below 30 indicates a sideways movement. The price trend is evident when the ADX breaks above 30. An increase in the ADX shows a stronger trend in one direction.
How to avoid the mistake?
Nevertheless, keep in mind that the indicator does not necessarily show whether a trend is bullish or bearish since its focus is purely on velocity.
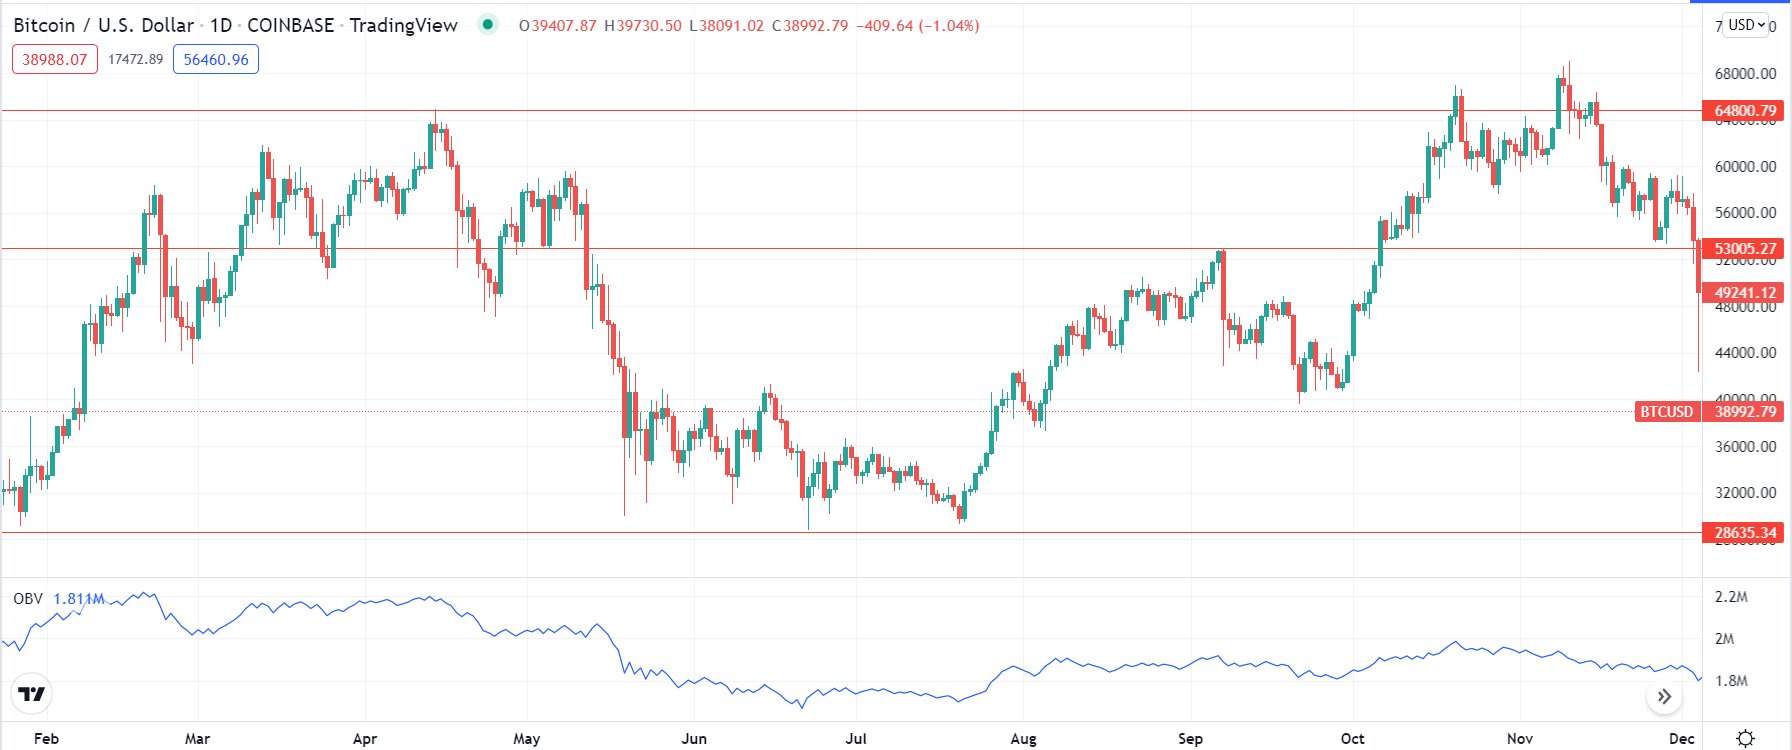
Tip 4. Use of support and resistance levels
The traders investigate support and resistance levels to detect reversals and pauses in the trend.
Why does it happen?
A price chart’s support level depends on the amount of demand that can temporarily reverse a downward trend.
How to avoid the mistake?
Resistance occurs by a concentration of supply, which stops an upward trend. Upon crossing over one of these barriers, the price movement becomes more volatile and gains momentum.
Tip 5. Use of CCI
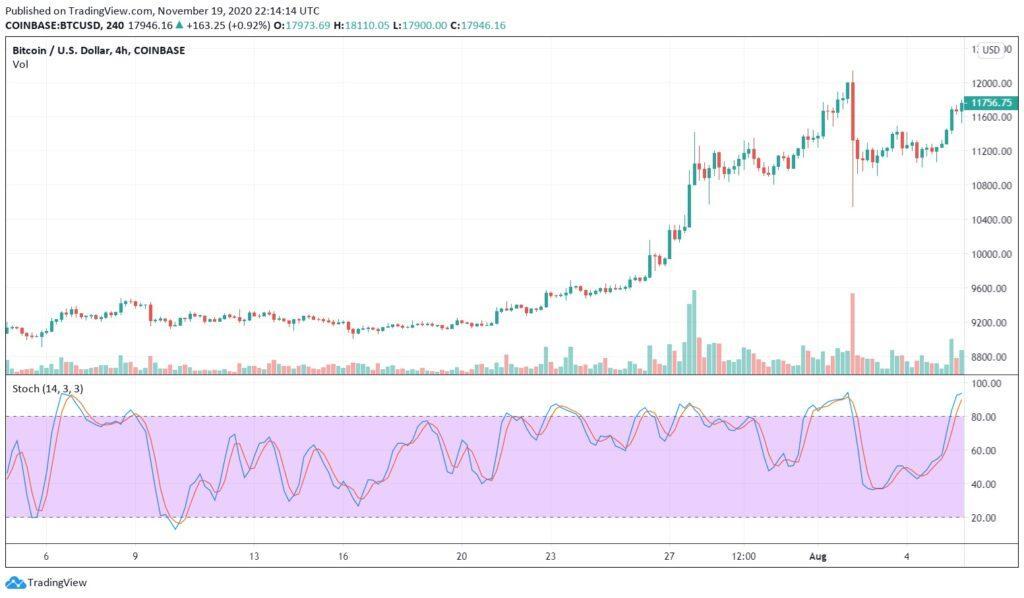
It measures the strength of a trend based on its momentum. This arrow works by measuring the difference between the current price and the historical average price over a given period.
Why does it happen?
The commodity channel above zero indicates a price above the historical average. Therefore, it is positioned in the middle of the chart.
How to avoid the mistake?
It shows that the price is below average when it is below zero. Conversely, its values above 100 indicate that the price is well above its historical average, and an uptrend occurs.
Final thoughts
Beginners will find this trading style easy to use. Such a strategy can be highly profitable if you can determine the velocity at the right time. Furthermore, it is suitable for long-term and short-term traders since it adapts to any time frame.
This approach’s downsides rely solely on market information and trends, which are subject to change. Market reversals can come as a surprise to traders. Depending on the deposit you’ve chosen, momentum trading might not be appropriate for leveraged securities due to the complicated futures markets that underlie them.
It is also possible for price fluctuations to occur without any prior warning, for example, from unexpected events or large transactions from whales.


