In traditional trading markets, you can measure volatility using a variety of indicators. Then what about cryptocurrencies? Are comparables available, and if so, how can they be used to facilitate better outcomes by trading?
Traditional assets have a long history and greater widespread acceptance than cryptocurrencies. That is why traders already have a wide range of volatility-measuring methods at their disposal. There are many examples of Bollinger Bands (BB), Average True Range, and CBOE Volatility Index. But can these principles be applied to cryptocurrency trading?
What is crypto volatility?
Volatility attracts traders, with more volume when volatility moves prices and creates trading opportunities. In a volatile market, prices are less likely to range, which gives investors more opportunity to enter trending positions (i.e., upwards or downwards). A market with little volatility is considered tedious and unprofitable, possibly with low liquidity.
Cryptocurrencies have attracted a lot of investors due to their significant volatility. The factor has allowed them to ascend to such high prices within a short time window. Traders need to be on guard, as volatility can cause stop-losses to blow up prematurely, leaving them out of potentially rewarding trades. Volatility looks like having a double edge.
How to trade cryptocurrency using volatile indicators?
- Keep an eye out
It’s a mantra you need to follow.
- Reduce the amount of trading you do
You can lose money and make money by trading less since the market moves more.
- Having patience is key
Don’t take every opportunity that comes your way.
- Managing your risks is essential
Don’t overtrade your account concerning the funding. For example, If you made 0.5 BTC longs at 5000 USD, your trading capital would have been $2500. A 0.5 BTC long trade now requires you to have about 6000 USD.
How to trade crypto volatility indicators?
Let’s learn more about the practical application of the crypto volatility indicator. You can create multiple strategies using the indicator. First, however, we discuss the simplest trading strategy, which is easy to implement and highly likely to succeed.
In this indicator, you may find the daily low, high, and open based on the crypto volatility. In addition, you may find the same levels based on weekly values. These levels serve as short-term and long-term support and resistance levels.
You can either use these levels to trade reversals or look for a breakout of the levels. The probability of success depends on the chosen instrument, time frame, and other factors like news, data releases, etc.
Bullish trade setup
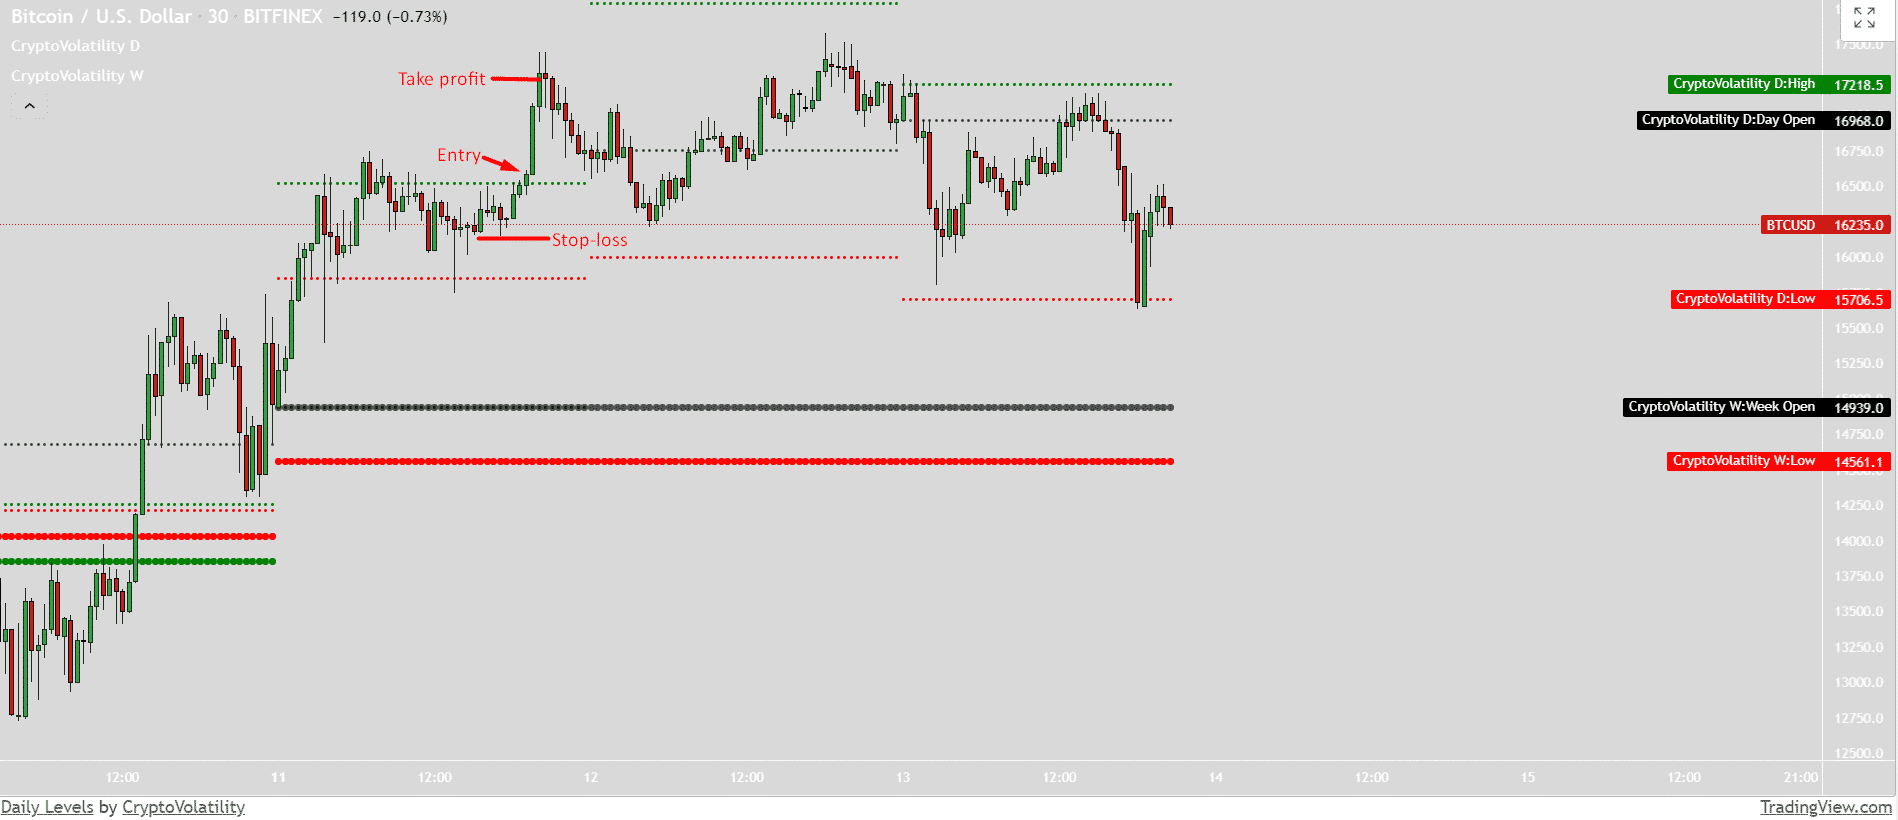
Let’s look at the bullish trade setup of the crypto volatility indicator.

Entry
Look at the horizontal green line that indicates the daily high. You may wait for the price to break the line and close above it. It is your long entry point.
Stop loss
You can place your stop-loss below the immediate consolidation zone. Then, the stop-loss can be below the swing lows for conservative traders.
Take profit
You can keep the take profit level twice the stop-loss. For example, the stop-loss is 40 pips. Therefore, your take profit should be 80 pips.
Bearish trade setup
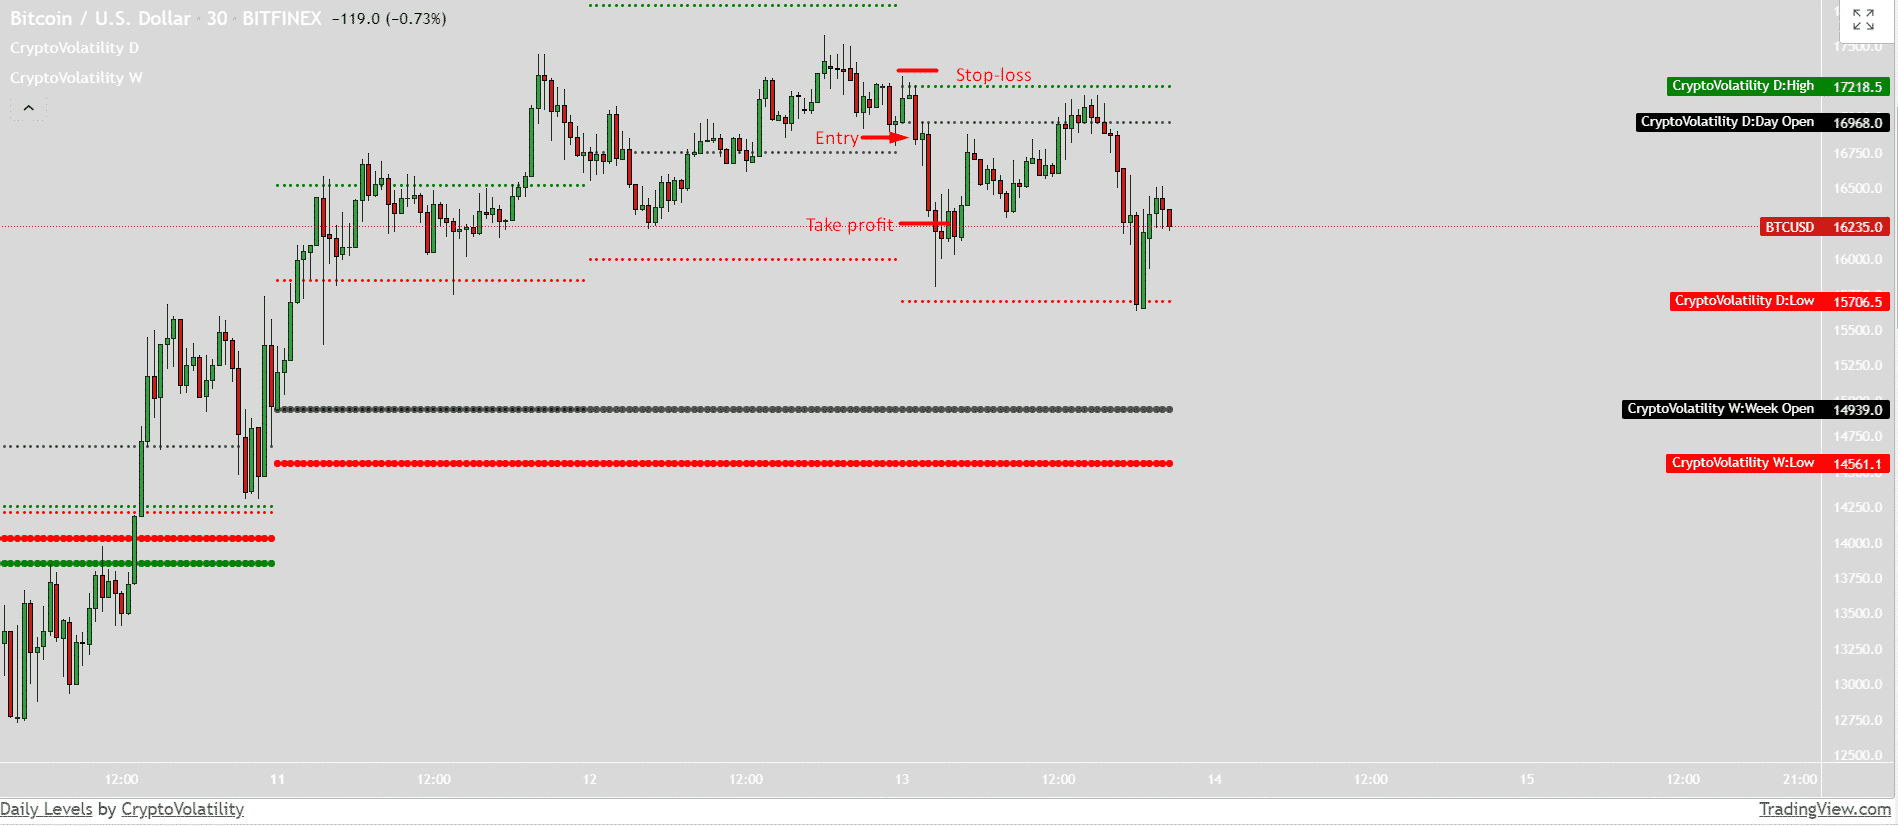
Let’s look at the bearish trade setup of the crypto volatility indicator.

Entry
Look at the horizontal dark green line that indicates the daily open. You may wait for the price to break the line and close below it. It is your short entry point.
Stop loss
You can place your stop-loss above the immediate consolidation zone. Then, the stop-loss can be adjusted above the swing highs for conservative traders.
Take profit
You can keep the take profit level twice the stop-loss. For example, the stop-loss is 40 pips. Therefore, your take profit should be 80 pips.
How to manage risks?
Risk management strategies should include the following elements:
- Risk per trade
How much are you willing to take on per trade? The value of this parameter depends on the risk profile of each trader. In percentage terms, it should represent the percentage of the trading account balance. It can range between 0.1% and 4% per trade.
Position sizing refers to the amount of an asset purchased or sold. You can establish position size using the risk per trade value since that parameter calculates the risk. Leveraged markets offer a more effective way to open a prominent position with a smaller investment. However, if not appropriately managed, the situation can still lead to substantial losses.
- Initially risky level
The initial stop-loss is set once you take the entry. Traders define levels based on the trading method they employ. The long entry stop-loss should be placed below a support level, for example, if you execute the trade around a support area.
- Trailing stop
At times, when the trade goes in the anticipated direction, the stop-loss order is moved to follow. In the event of a market reversal, we plan on locking in some profits. There are many different strategies for trailing the risk, but generally, moving averages, valid average ranges (ATRs), and trend lines are the best indicators to reduce risks.
Profit target describes the area where the trader will profit from a position. A reasonable profit target should have an asymmetric risk-reward ratio, which means the potential gains are several times higher than the potential risks.
Pros |
Cons |
| The crypto market is highly volatile. It is where trend strategies will be beneficial for capturing a specific change in interest. Additionally, during periods of consolidation, breakout strategies serve well. | Consequently, volatility indicators cannot determine the direction of the trend. Thus, an uptrend can cause the indicator to fall, while a downtrend can rise. In other words, it cannot indicate when a trend began or ended. |
| Strong trends indicate price movements that are as close as possible to their upper and lower bands. If one price band moves to another, it suggests a trend change or a consolidation period is about to begin. | BB is an advanced indicator, but this is not ideal since the tool has an unavoidable delay in chart signal formation. In any case, volatility indicators are an essential part of your strategy for successful trading in the financial markets. |
| A low level of volatility. Combining reversal trading strategies with direct support and resistance levels is best to use them. A channel-based strategy is more appropriate in this case. |
Final thoughts
BBs are a popular volatility indicator in the crypto markets. An indicator of volatility tracks changes in market prices over a specified period as an important technical analysis tool. It also typically signals if the market is overbought or oversold, indicating a trend reversal or stall.


