To perform a successful technical analysis, one must choose technical indicators wisely. Retail traders rely primarily on technical analysis to make their calls since sometimes the fundamental analysis has a delayed impact on the price.
The technical analysis measures, through its indicators, the development of the market so the trader can better understand what is going on and make the right decision. Traders who understand the indicators are ready to create their winning strategy.
We picked up for you the top ten forex indicators a trader should know. We could classify indicators into many categories, but the two primary are leading and lagging indicators.
Thus, leading indicators predict the direction in which prices are likely to go in the future while lagging indicators indicate how prices behaved in a given period.
Let’s fall into one of these two categories.
Moving average
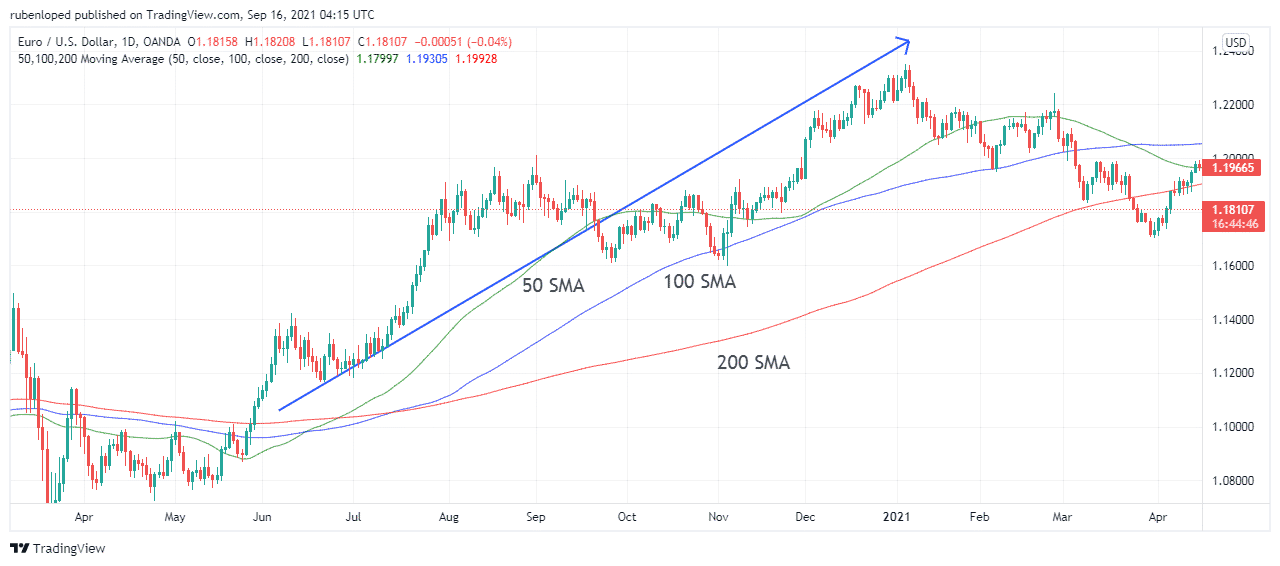
The moving average is one of the most important and popular indicators. It reduces the noise of the market by showing the average price during the chosen time frame. It is also known as a simple moving average (SMA).
Traders can set different time frames for the SMA based on their objectives. As with any indicator, longer time frames give stronger signals. However, for short-term trades, it is more useful to use shorter SMA.
When the price is above the MA, the trend is bullish. Otherwise, when the price moves below the SMA, the trend is bearish. This way, traders use SMA as support and resistance levels.
Moving averages with different time frames are combined to get signals about the direction of the price. It is considered a lagging indicator.
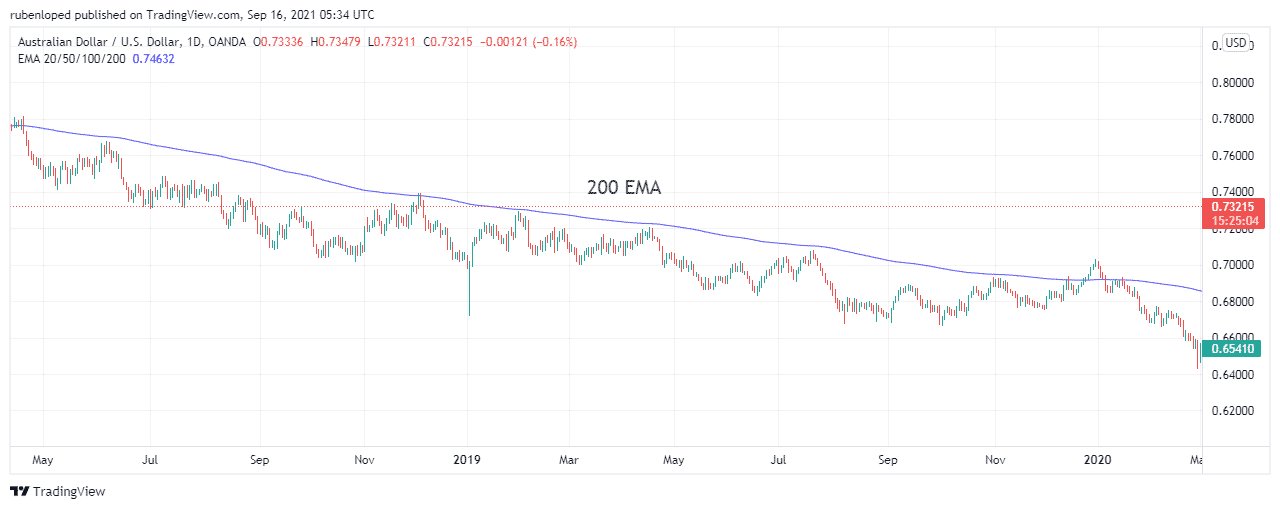
Exponential moving average
The EMA follows the same principle of the SMA but gives more weight to recent data. The exponential moving average is often used as a primary indicator on which more complex indicators are built. Such is the case of the MACD.
By giving more weight to the recent closing price, EMA shows more efficient data for short-term traders like intraday traders.
However, the 50-day and 200-day EMA can also be used to evaluate long-term trends. It doesn’t make much sense to compare the SMA and the EMA to determine which one is better. However, depending on the market and the time frame, both indicators can be useful. It is considered a lagging indicator.
MACD
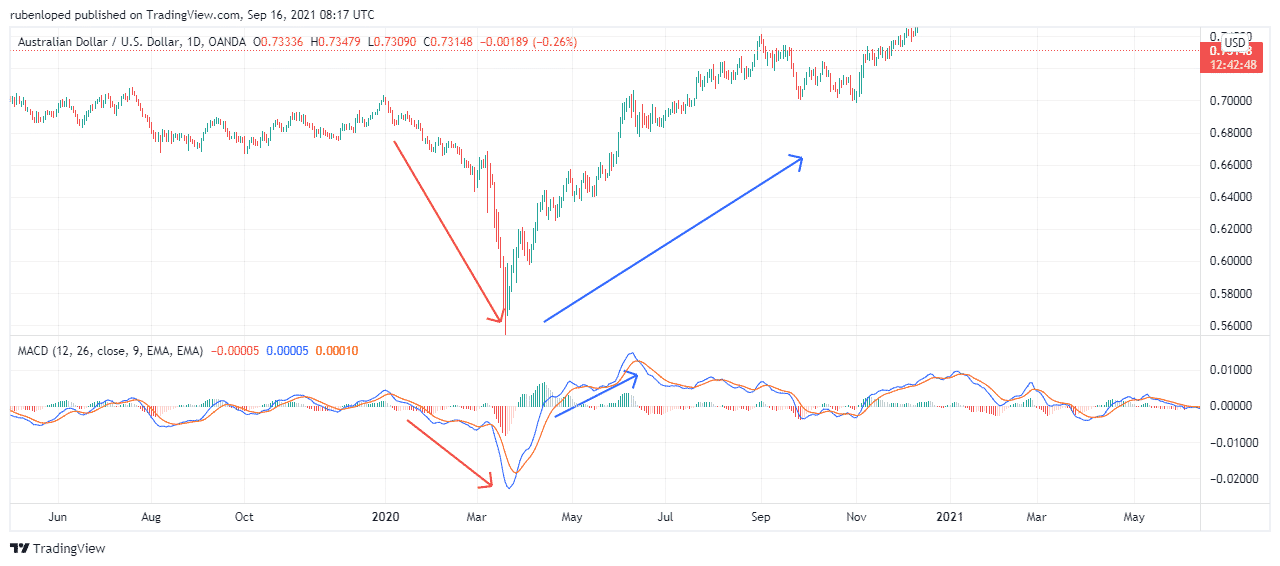
The Moving average convergence divergence is a momentum indicator that combines two moving averages to trigger the buying and selling signals.
- When the MACD crosses above, it is a signal to buy.
- When the price crosses below, it is a signal to sell.
Thus, it is considered a lagging indicator.
Relative strength index (RSI)
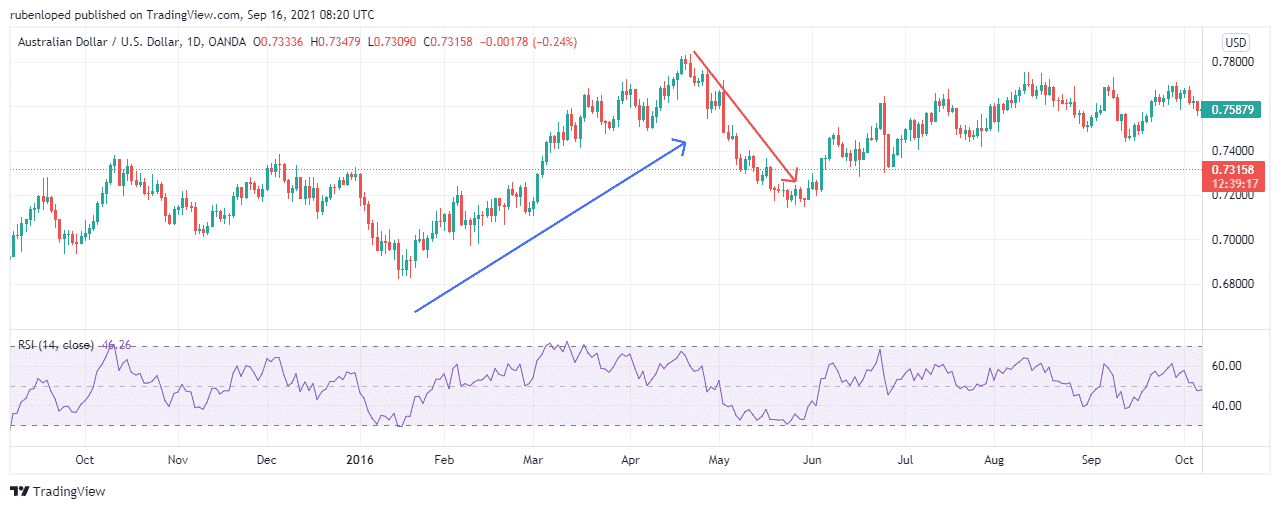
This indicator measures the momentum of a trend by measuring the speed at which the pair price is changing. The RSI has a relative measure system that goes from 0 to 100.
- When the index is at 30%, traders consider the pair oversold, and one can expect an uptrend once the index level rises quickly.
- On the other hand, once the index is at 70% or above, it is considered overbought, and we can expect a downtrend.
Therefore, it is considered a leading indicator.
Bollinger Bands
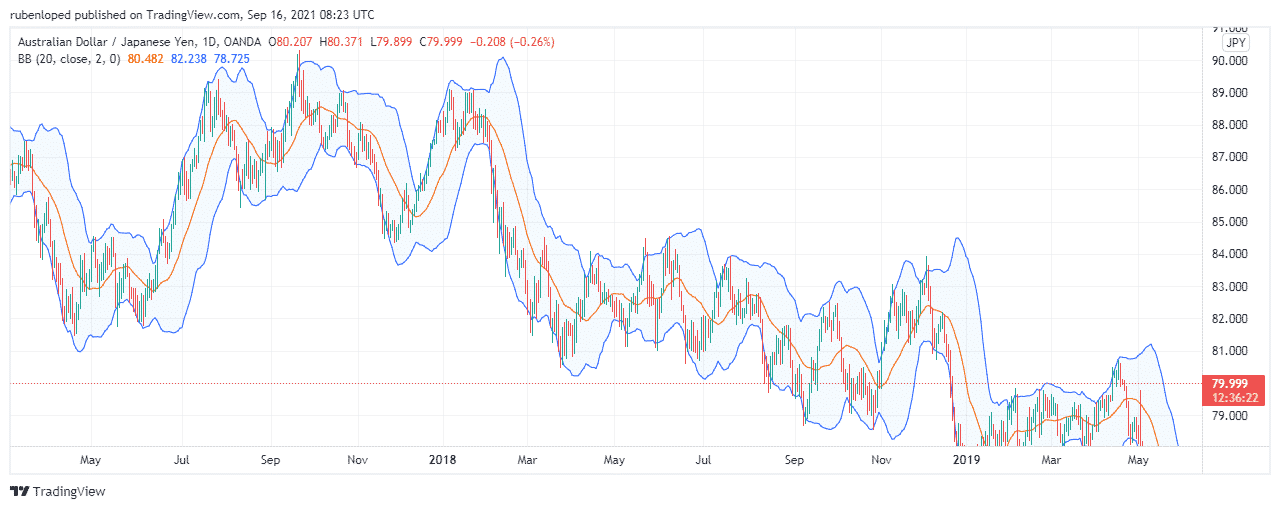
John Bollinger developed The Bollinger Bands (BB) in the 1980s. The bands are at an equal distance from the price at an established number of standard deviations. The BB measures the volatility. So it predicts that the price will stay between the two bands. Thus, one can think of Bollinger bands as support and resistance levels.
- When the pair price touches the upper band, the pair is overbought.
- When the price reaches the lower band, the pair is oversold.
Thus, it is considered a leading indicator.
Stochastic oscillator
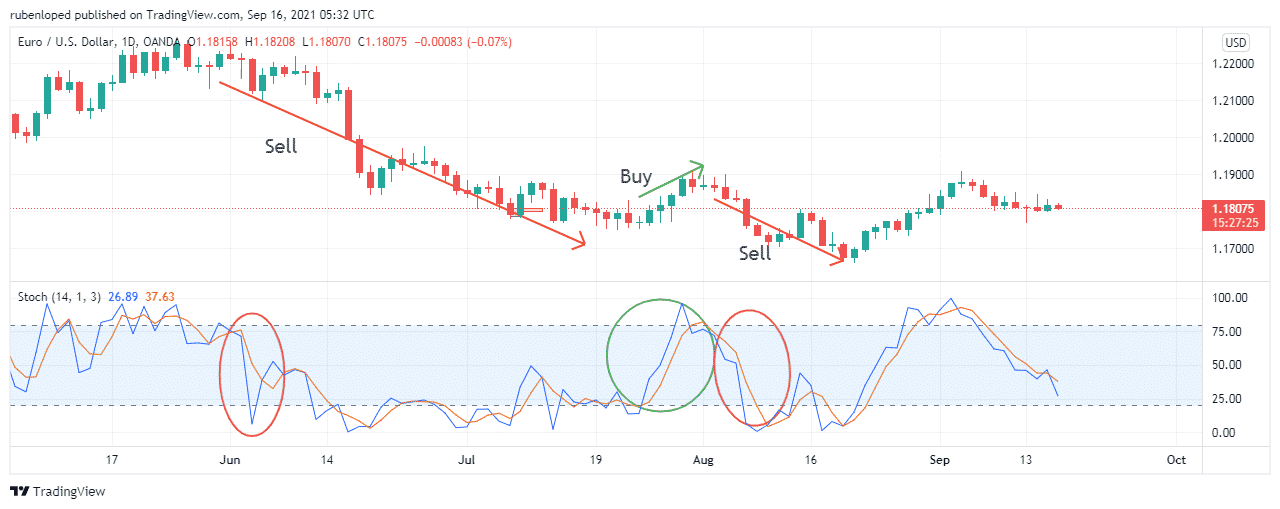
The Stochastic oscillator is an indicator that compares the last closing price with the closing prices of the previous sessions. The indicator is made out of two lines: %K line and %D line.
- The %K line consisted of the lowest price of the last 14 periods, the higher price of the last 14 periods, and the last closing price.
- The %D line consisted of the moving average of the last three periods.
A stochastic oscillator is a relative index that goes from 0 to 100. When the index is over the 80% level and then goes down, you should sell. On the contrary, when the level reaches 20% and then goes up, you should buy. Therefore, it is considered a leading indicator.
Fibonacci retracement
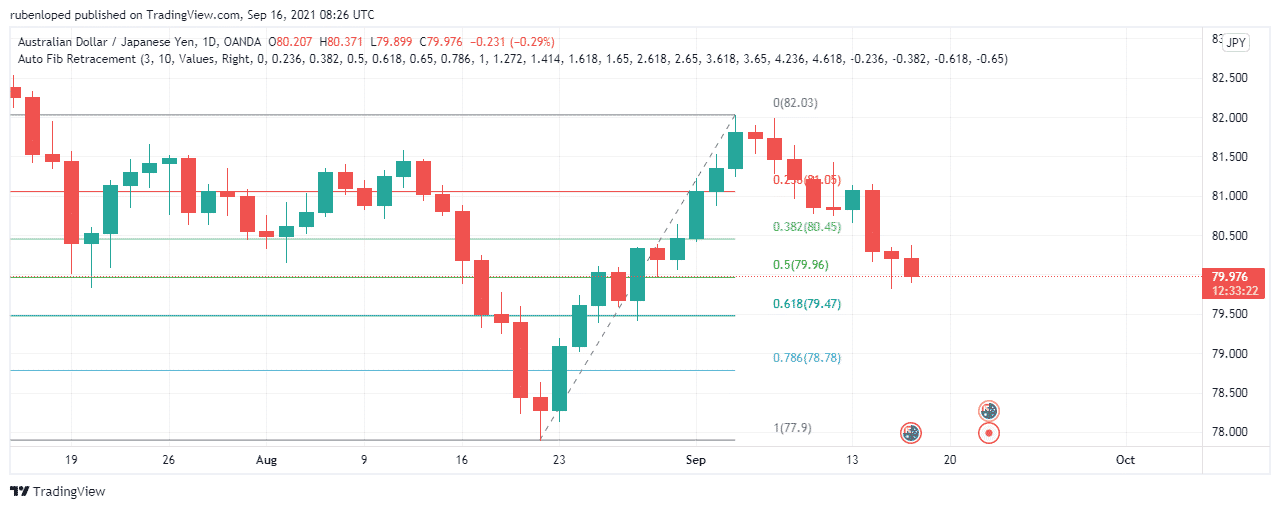
This indicator is based on the famous Fibonacci sequence. It can predict retracement and expansion levels. Fibo retracement establishes support or resistance levels after a trend. So basically, when a trend reverses, the price will retrace to one of Fibonacci’s retracement levels. The most used Fibonacci ratios are 23.6%, 38.2%, 50%, 61.8%, and 100%. It is considered a leading indicator.
Ichimoku
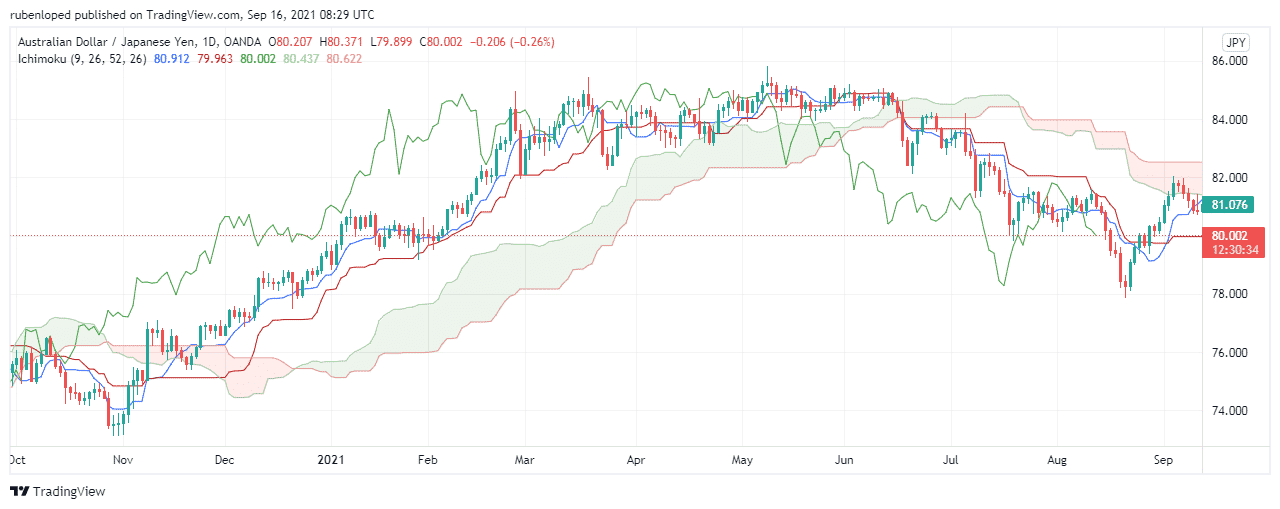
This indicator was a secret for decades. It’s an indicator that pretends to show all the relevant information for the trader at one in a convenient way. It consists of six elements.
The Ichimoku gives traders levels of support and resistance, trend direction, momentum, and trading signals. It might appear not easy to comprehend at first, but it’s a simple indicator that accomplishes the purpose for which it was created, providing traders with the information they need. Therefore, it is considered a leading indicator.
Parabolic SAR
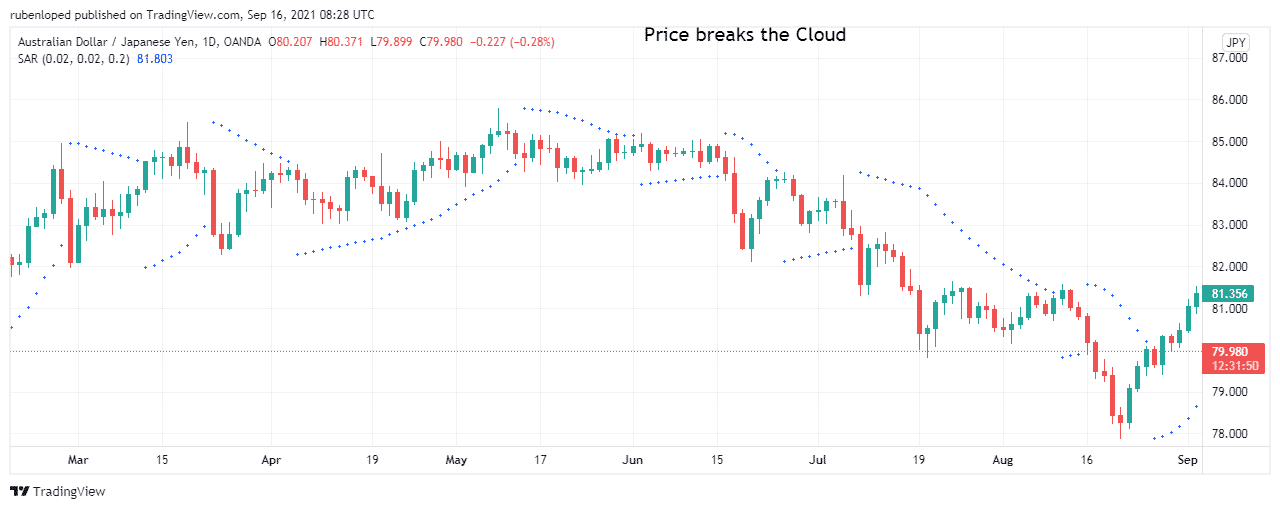
Similar to the moving average, the parabolic SAR analyzes market trends. When the trend is up, the indicator sits below the price line.
The primary purpose of this indicator is to signal when a trend might be reversing. If the trend is down, the indicator is above the price. Therefore, it is considered a leading indicator.
On-balance-volume (OBV)
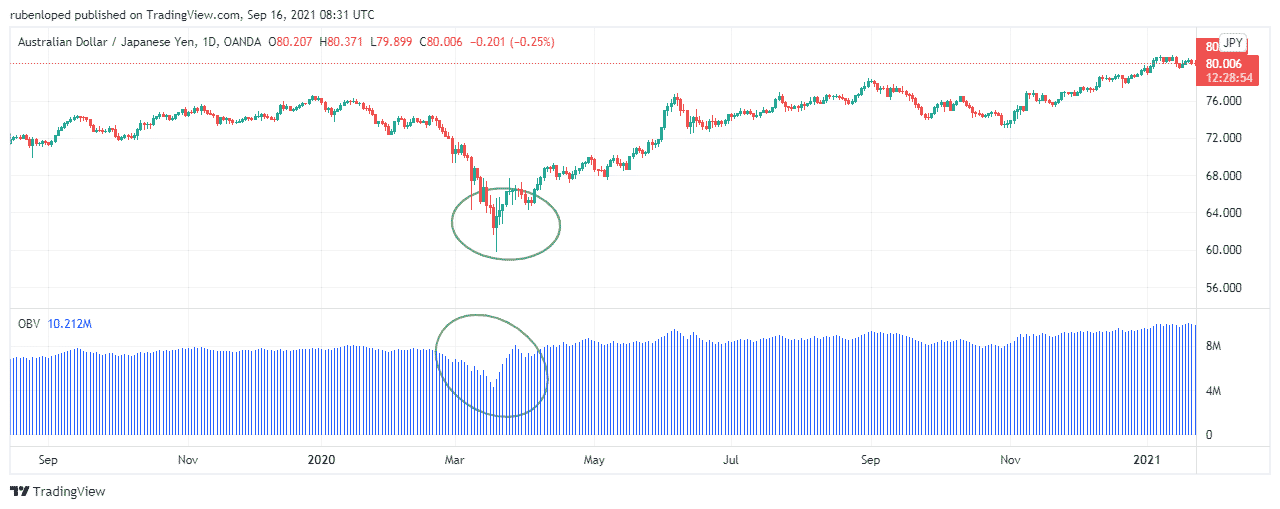
It’s a momentum indicator that uses the volume of transactions to predict the price of the asset. In theory, when the volume rises or falls significantly, the asset’s price will eventually respond to it. As the FX market is decentralized, there is no way to count the total volume, so the impact of the OBV indicator is limited. Brokers only report the volume in their systems. It is considered a leading indicator.
Final thoughts
Technical traders have many resources to use before making any call. It is difficult to say that one indicator is better than the other. Numerous factors will influence this decision, including the market, the time frame, and the level of risk acceptance.
A good trader should always study as many indicators as possible to build a vital strategy step by step.
