Guppy multiple moving average (GMMA) indicator is a unique tool that uses different MA lines to determine trading opportunities. It is common among crypto investors to rely on several technical indicators to generate more efficient trading ideas while making decisions. So it makes sense that the tool has become attractive to market participants for its simplicity and unique features.
However, it is not wise to start using any technical indicator without learning its components and the professionals’ way of use. This article will dive deep into the GMMA indicator and list the top five tips that every market participant should know when using the tool.
What is the GMMA indicator?
It is a custom-made technical tool based on the MA concept. It uses two sets of Exponential moving averages to determine the current trend, trend switching points, and breakouts. An Australian financial columnist is the developer of this indicator, Daryl Guppy. The author first introduces this concept or indicator “Gyppy” in his book “Trading Tactics.” This indicator’s two sets of EMA lines.
Each group contains six EMA lines:
- The short-term group uses lines of parameters 3, 5, 8, 10, 12, and 15.
- The long-term group uses lines of parameters 30, 35, 40, 45, 50, and 60.
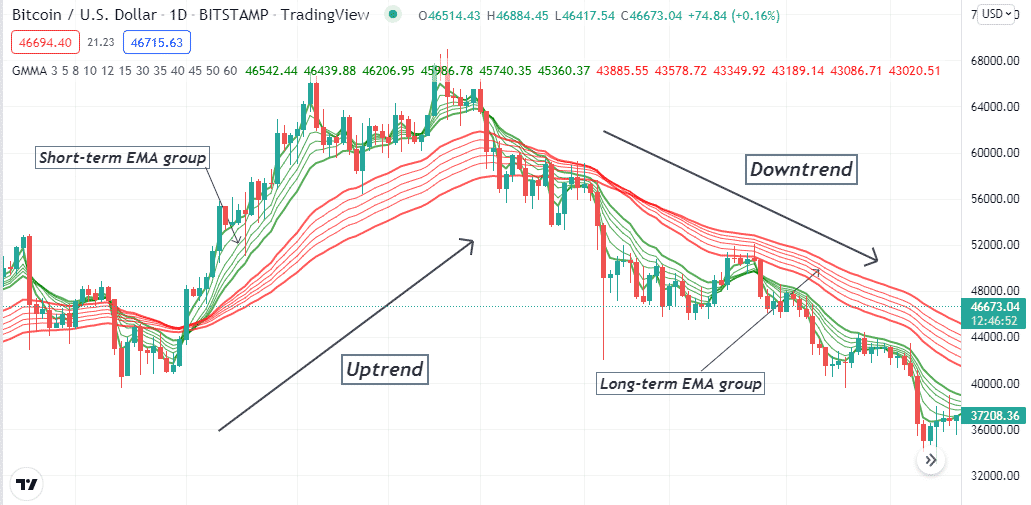
Both groups contain different colors of EMA lines, and every EMA line of a particular group is the same. Financial traders usually use the crossover between these groups to generate trade ideas or consider the readings while making trade decisions.
The top five tips to trading with the GMMA indicator
Now you know what the indicator is, let’s consider how you can trade using this indicator like a pro-crypto trader.
Tip 1. When opening buy trades
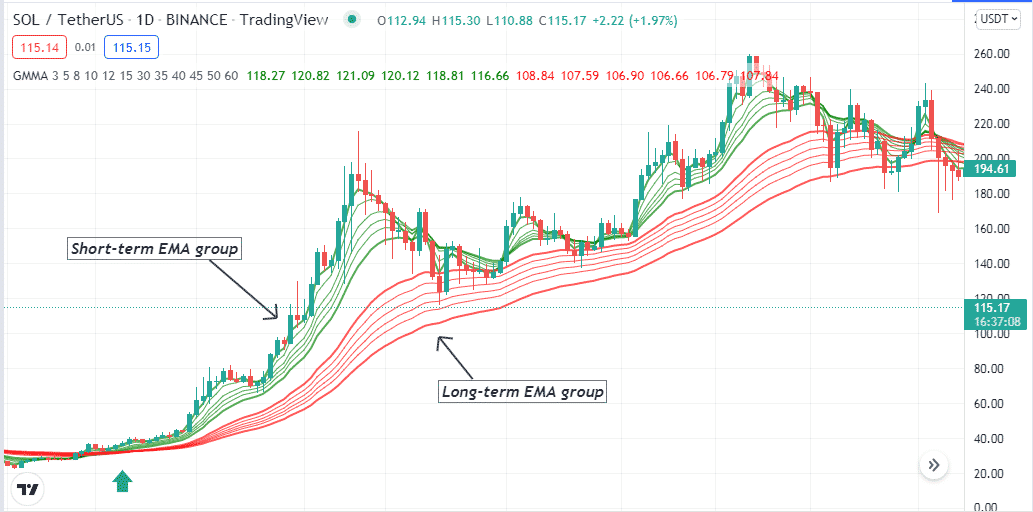
When seeking to open buy positions using the GMMA indicator, you need to remember a few things. When a bullish momentum comes up, the price first surpasses the short-term EMA group and then the long-term EMA group on the upside. Another thing is the price will stay above the short-term EMA group confirming an uptrend.
Why does this happen?
The indicator uses the popular MA crossover concept as the minor MA crosses the large MA on the upside, determining a bullish momentum.
How to avoid mistakes?
Wait till all EMA lines of the short-term group cross above all the EMA lines of the long-term group to confirm the bullish momentum. Ignore if the price rises above all EMA lines and declines back quickly.
Tip 2. When opening sell trades
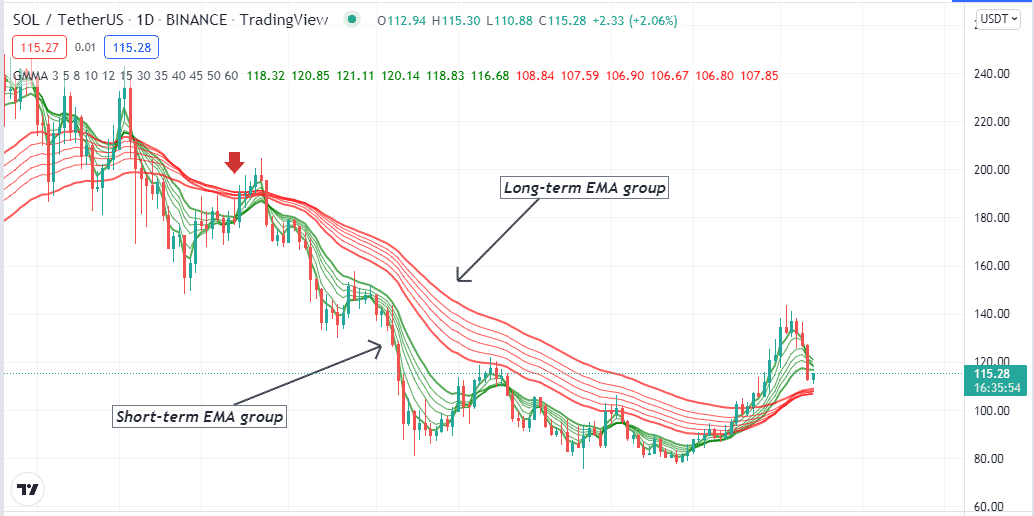
When seeking to open sell positions, use the indicator two things to remember. First, when a bearish momentum initiates, the price first declines below the short-term EMA set and then the long-term EMA set. Another thing is the price will remain below these EMA lines confirming the bearish trend.
Why does this happen?
The indicator uses the popular MA crossover concept as the bearish momentum initiates the EMA lines of shorter periods to drop below the EMA lines of the longer periods.
How to avoid mistakes?
Don’t make a quick entry into the marketplace. Confirm the momentum and trend by observing EMA lines. Only enter at sell trades when all the EMA lines of the short-term group of the GMMA indicator drop below the EMA lines of the long-term group and ignore tiny fluctuations.
Tip 3. Identify the strength
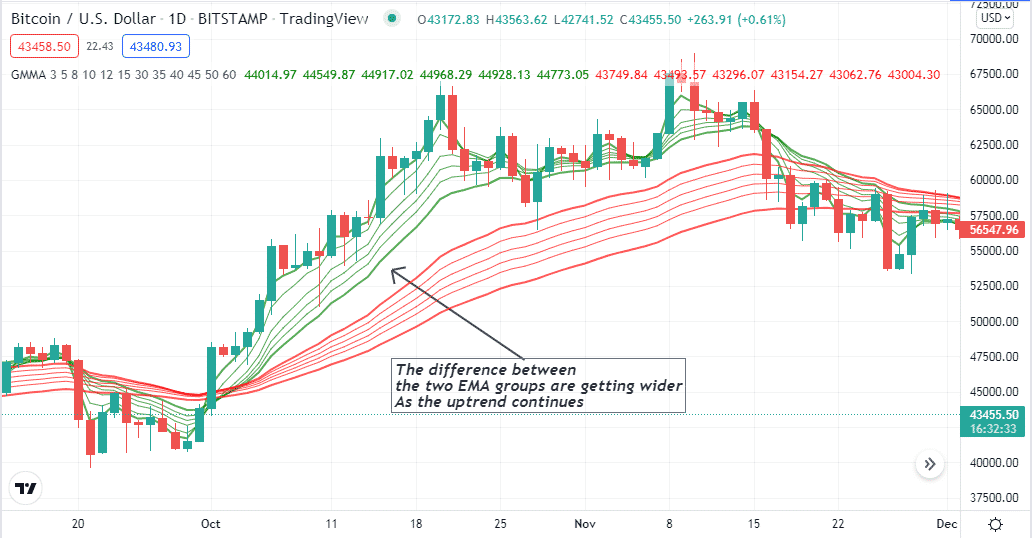
You can identify the strength of the current trend using the indicator. As the gap between the two groups of EMA lines gets wider, it declares more strength of the current trend. When the EMA lines of both groups start getting closer, it declares the strength of the current trend is fading.
Why does this happen?
It happens as the GMMA indicator defines momentum based on price change. When the price changes rapidly and volume increases, the short term EMA moves closer with the price, and the distance gets wider with the long-term EMA line.
How to avoid mistakes?
You can check this concept on a chart but do not enter trades using this concept in short-term time frames like 1 min or 5 min. Using this concept properly, you can obtain the market context in long-term timeframes and enter trades at short-term time frames.
Tip 4. Identify the consolidating phase or sideways
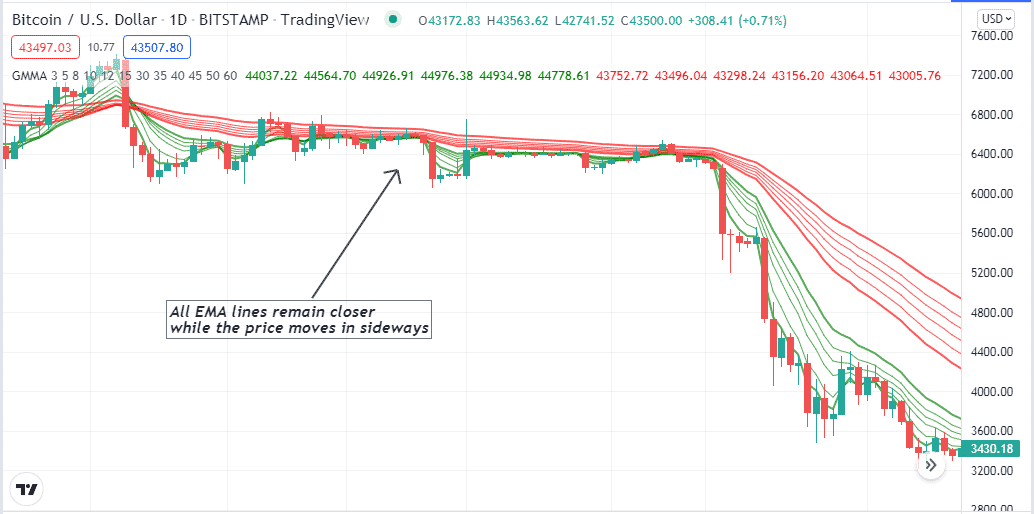
It is easy to identify sideways through the GMMA indicator when all 12 EMA lines of both groups get closer and frequently make crossovers that declare the price in a consolidating phase.
Why does this happen?
As the price movement loses strength and the confusion or indecision among participants continues, the price remains in a range, so the EMA lines get closer and make crossovers.
How to avoid mistakes?
Don’t enter trades in ranging markets using the GMMA indicator as this indicator is no good indicator to generate trade ideas while the price moves sideways or there is a lack of trends.
Tip 5. Using the RSI indicator with the GMMA indicator
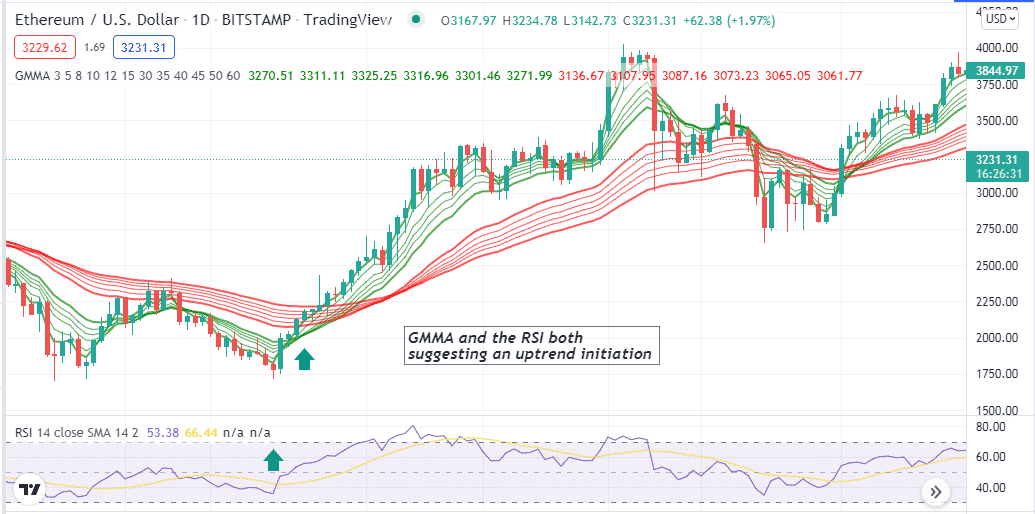
Financial investors often combine two or more indicators to obtain the market context and determine trading positions. You can use the RSI indicator as a supportive indicator alongside the GMMA indicator to execute more potentially profitable trades.
How does this happen?
First, confirm the trend-changing points through the GMMA indicator reading, then match the reading with the RSI indicator before executing trades. For example, when the price enters a bullish trend, the EMA lines of the short-term group will reach above the EMA lines of the long-term group and then check the RSI indicator. The dynamic line should be near the central (50) line and head on the upside. The exact opposite scenario will happen for bearish momentum.
How to avoid mistakes?
Check and match both indicators readings carefully before entering any trade.
Final thought
This is an efficient indicator easily applicable to many financial instruments, including cryptos. We suggest mastering the concept by practicing before using it in live charts alongside following proper money and trade management rules when trading using this indicator.


