Traders always seek potential technical structures to catch profitable trading positions besides fundamental information about the target asset. Successful traders in the financial market commonly use various candlesticks or candlestick patterns to identify good positions as candles represent the price movement.
Each candle contains price movement information for a specific period, leaving a footprint on the asset price and helps to find the upcoming direction.
Hammer is one of the most popular types of candles among technical traders. Price action traders frequently use this candle type to take positions at the financial assets. When you want to use a candle type to sort out profitable trading positions, you need to clearly understand the candle type and concept.
This article includes all you need to know about the Hammer candlestick, the differences between Hammer and Doji candlesticks. We also make a list of advantages and limitations for Hammer candlesticks. Having a clear concept and this understanding will guide you to catch potentially profitable trades using these candlesticks.
What is a Hammer candlestick?
It is a single candlestick formation that commonly occurs by the price movement of any financial asset. When you see a hammer-type candle at the end of any trend, that trend may end soon. The primary characteristic of this type of candlestick is that it must have a longer wick than the candle’s actual body.
These candles don’t have any upper shadow. Tiny upper shadow may be considerable. Meanwhile, the lower shadow will be as long as twice the body of the candle or more than that.
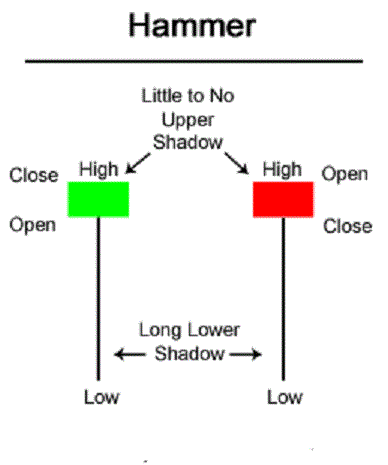
The figure above shows different types of hammer candles, green or red. It occurs when both the open and high are the same. Otherwise, the high and close is the same for the bullish Hammers and vice versa for the bearish Hammers.
In both cases, there must be a long wick at any one side of the candle, while the other side has no wick or a tiny wick.
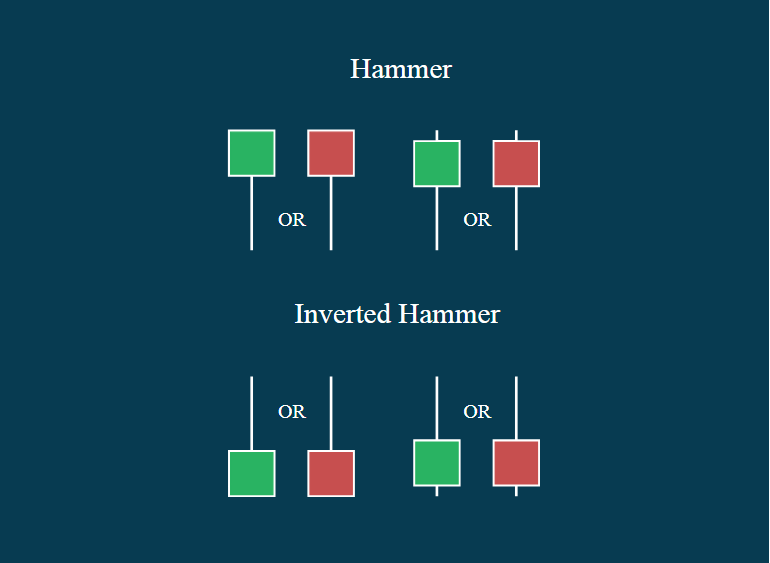
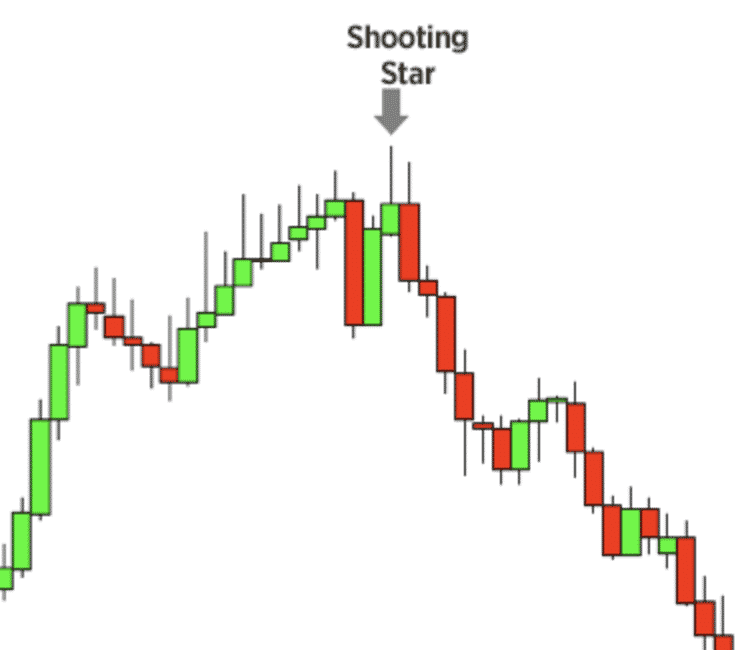
Another type of this candle is the Inverted Hammer, which looks the opposite of the traditional Hammer. Treder often calls it a Hanging man when a Hammer candle appears after an uptrend. The financial market participants also call them a Shooting Star if it shows at the edge of an uptrend.
Explanation and types of Hammer candlestick
The primary explanation of an ideal green Hammer candlestick is it may open or start from a specific price and start to fall more downside, and it may face support and begin to go upside. The ending or closing price for the green Hammer is the same as the high of that candle.
A tiny wick at the upside may be considerable. On the other hand, the explanation for a red Hammer is different. The opening or starting price and high of the candle are the same. Price starts to fall after opening from a specific price; buyers begin to dominate and push the price at the upside, candle close near the opening price.
So the candle color remains red. Hammer candles are more effective when at the end of a downtrend. Experts list Hammer candles as a reversal pattern because when it occurs, price movement may change the direction when it appears. Large wicks of Hammer candles confirm the price rejection from a certain level.
Bullish Hammer
It appears at the end of a downtrend. Either a green Hammer or a red one both confirms the buyer’s domination at the price movement.
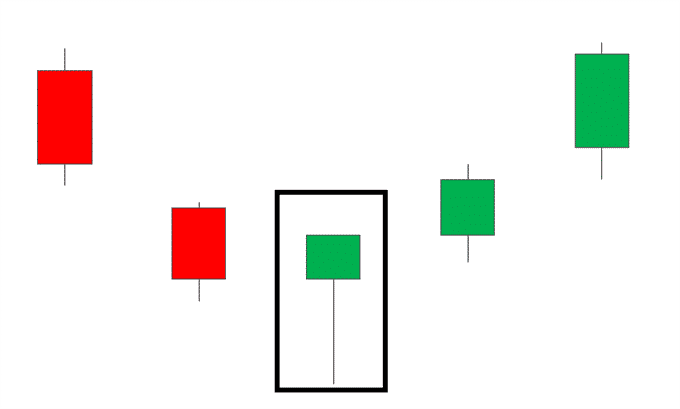
The figure above shows an ideal bullish Hammer candle. The price action trader uses a Hammer candle as a suggestion to enter the market. It is especially true when it appears at the critical levels for the asset price, such as historic levels, necessary dynamic support or resistance levels, and Fibonacci retracement levels.
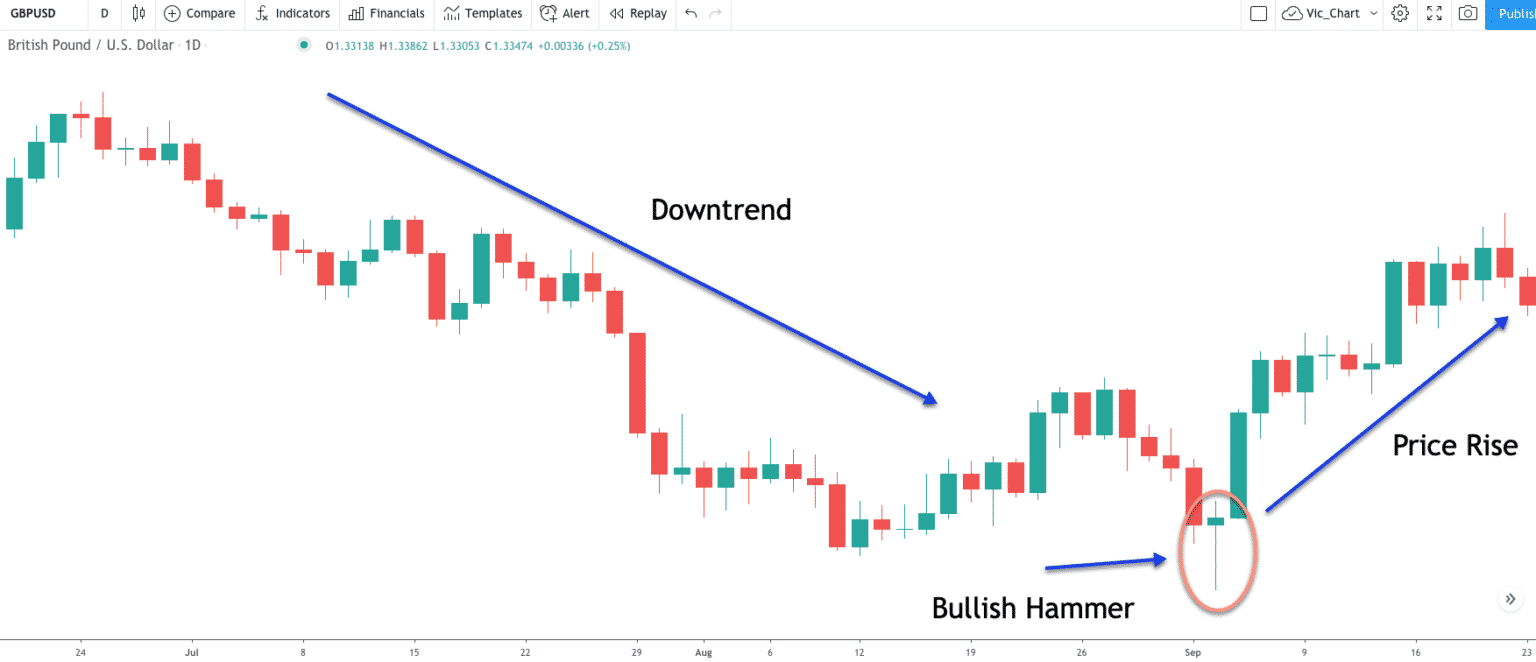
The figure above shows a daily chart of a GBP/USD — a perfect example of an ideal bullish Hammer.
Inverted Hammer
It looks the opposite of a bullish Hammer; it has a long upper wick. When it appears at the end of a downtrend, it signals potential upward movement like the traditional Hammer candle. No matter if the body of the Inverted Hammer is red or green, it signals the same.
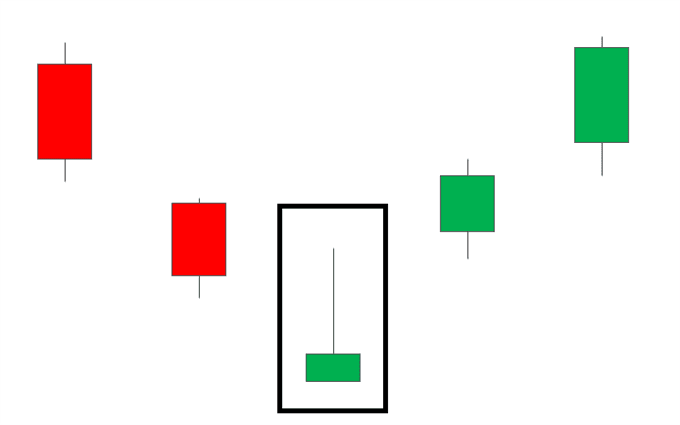
The figure above shows a green Inverted Hammer. When it appears at the end of an uptrend, professionals call it a Shooting Star, which generally occurs when the uptrend may end, and the asset price may fall. Look at the daily chart of USD/CAD below, which shows a perfect example of an ideal Shooting Star.
Difference between Doji and Hammer candles
Doji candles allow wicks at both sides of the candle body, while Hammer will enable wicks at only a specific side, either upside or downside. Doji candles have a small body in comparison to Hammer candlesticks.
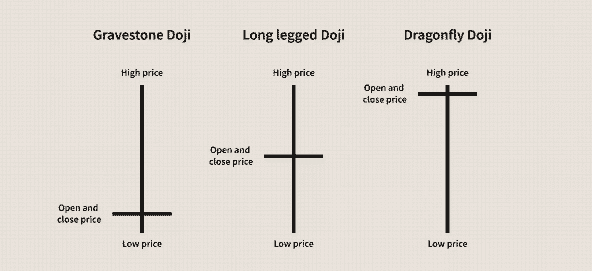
Hammer candles are only used for reversal signals, while Doji candles signal reversal or continuation of the trend. These are the significant differences between these two types of popular candlesticks.
Advantages of Hammer candlesticks
You can use these candlesticks for potentially profitable entry positions when it appears at the critical levels. It suggests entries with low risk and high rewards, and you can use it to close your trade. When you have sell positions, and it appears you can consider that as a profit-taking level.
Limitations of Hammer candlesticks
They also have limitations, such as there is no guarantee that it appears and the reversal price starts. It can send false signals. Again another limitation is this type of candlestick needs supportive evidence such as critical support-resistance level, historical level, etc.
Final thoughts
We suggest not to trade with only the suggestion of Hammer candlesticks. Moreover, it’s better to check the additional facts supporting the signal for potential price direction and not make early entries without confirmation.


