Support & resistance (S/R) is a crucial term to discuss as the price starts changing trends or bouncing back at these levels, which prevent the asset price from continuing in the same direction as it is moving. Buyers try to open positions at the support levels, and most intelligent sellers wait at the resistance levels to sell the asset. These areas are essential as their identification increases profitability and reduces the risks on trading capital.
There are several ways to identify S/R levels in the FX chart. Professional traders use some popular techniques. Moreover, different phases of the market, such as sideways, uptrend, and downtrend of the price movement, affect the usage of S/R levels.
Let’s check the best ways to identify these areas and a trade management idea.
Types of S/R levels
The price movement in the FX chart happens with the change in supply and demand. We can identify the change with the static and dynamic S/R.
- Static levels remain fixed as a horizontal line
- Dynamic levels move with the price
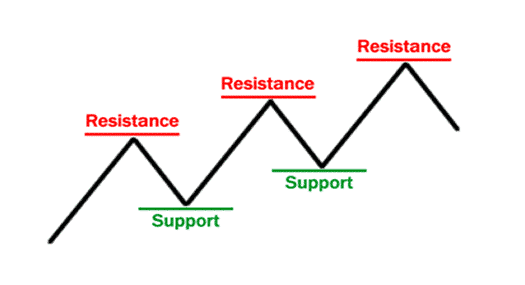
Now see how support and resistance work in the ranging market.
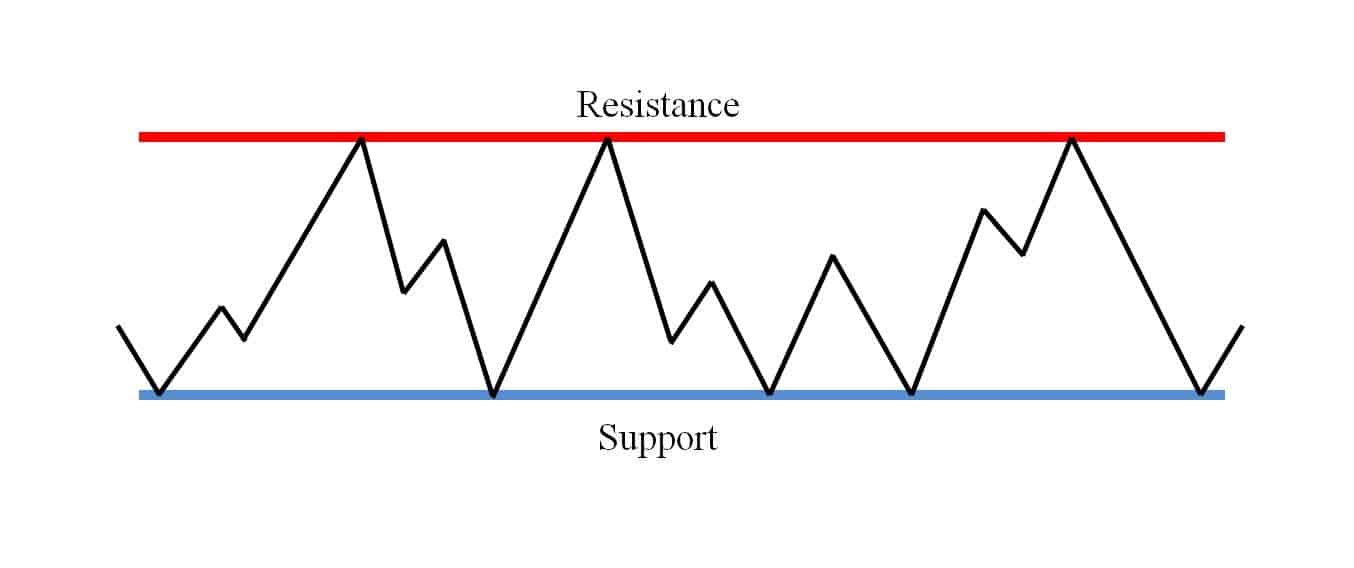
- Support areas form at the end of a downtrend, indicating that the price doesn’t want to fall more.
- On the other hand, prices have stopped at resistance areas, which have static and dynamic formations.
Let’s see how the S/R works in the current chart.
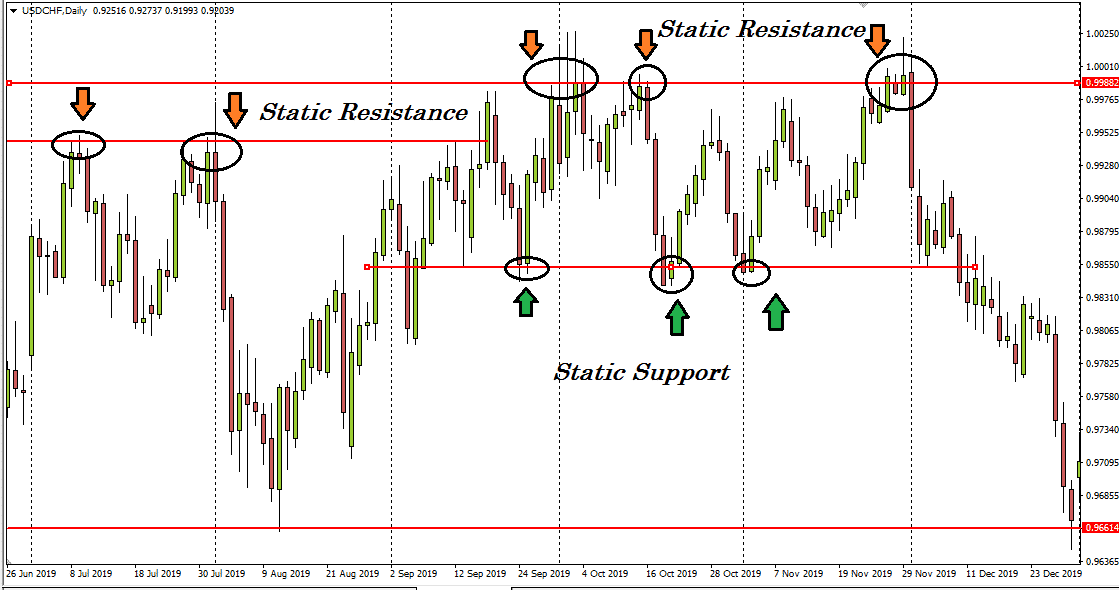
- When price violates any resistance level, it becomes the support.
- When a level works as both support and resistance level, it is most valuable in the chart.
Buyers and sellers both remain active in such areas.
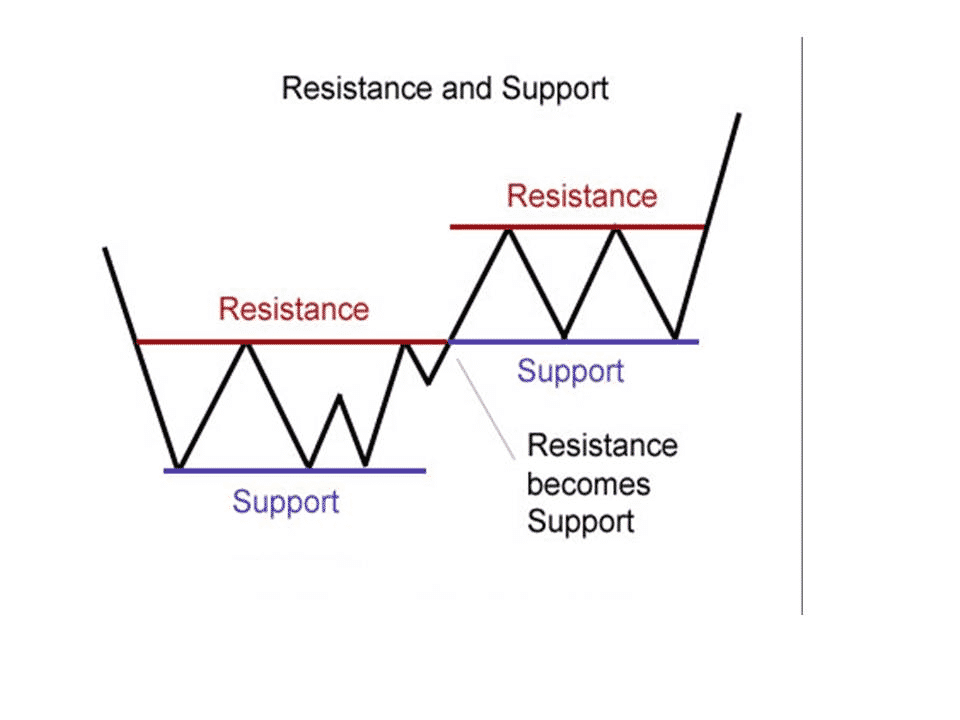
Similarly, it is expected that the support level may act as the next resistance level after breaking at the downside. Switching roles of these levels are typical at the FX or stock market.
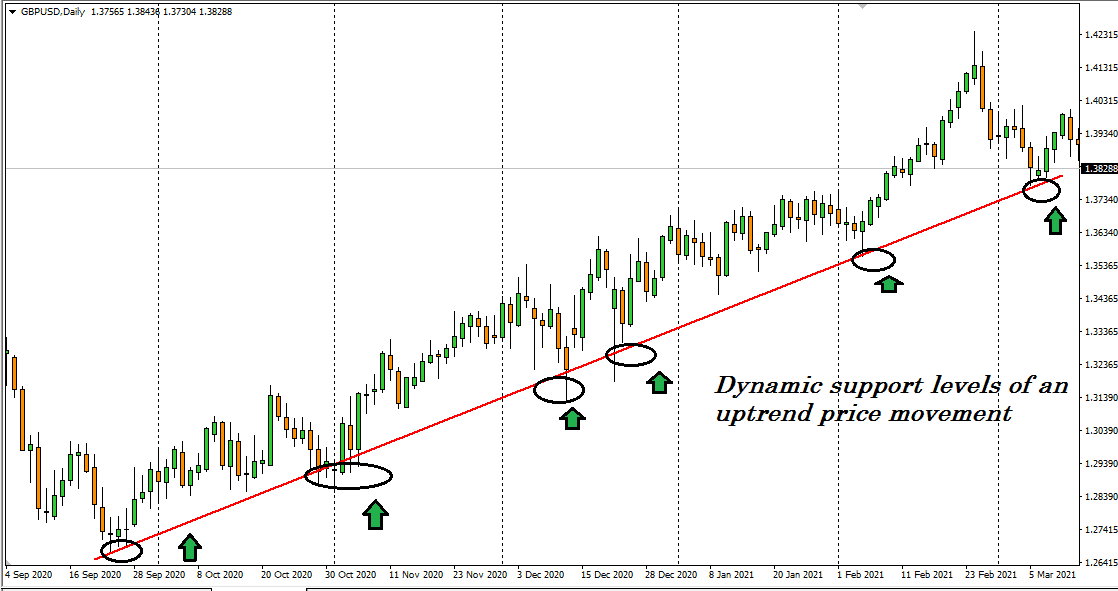
The figure above shows how the trendline support works in the daily chart of GBP/USD. The idea is to add lower lows of the uptrend price movement, and the figure shows the effectiveness.
How to find the best S/R levels?
There are several ways to identify these areas. Let’s list the best.
- Using round numbers theory
According to trading psychology, the round numbers are the most potential area where most pending orders get executed. The institutions and financial firms place orders at these levels, so the other market participants also.
For example, according to the historical data, levels such as 1.30, 1.25, 1.20, 1.15, etc., are significant for most major pairs. This theory of round numbers also works fine at stock prices, which faces some extra buying/selling pressure at the levels such as 10$, 20$, or 50$. Participants wait for the price to reach them.
- Using trendline
You can use trendlines to find significant price levels like professionals. Drawing a trendline by adding lower lows or higher highs can help you identify the following S/R area that the price moment will create.
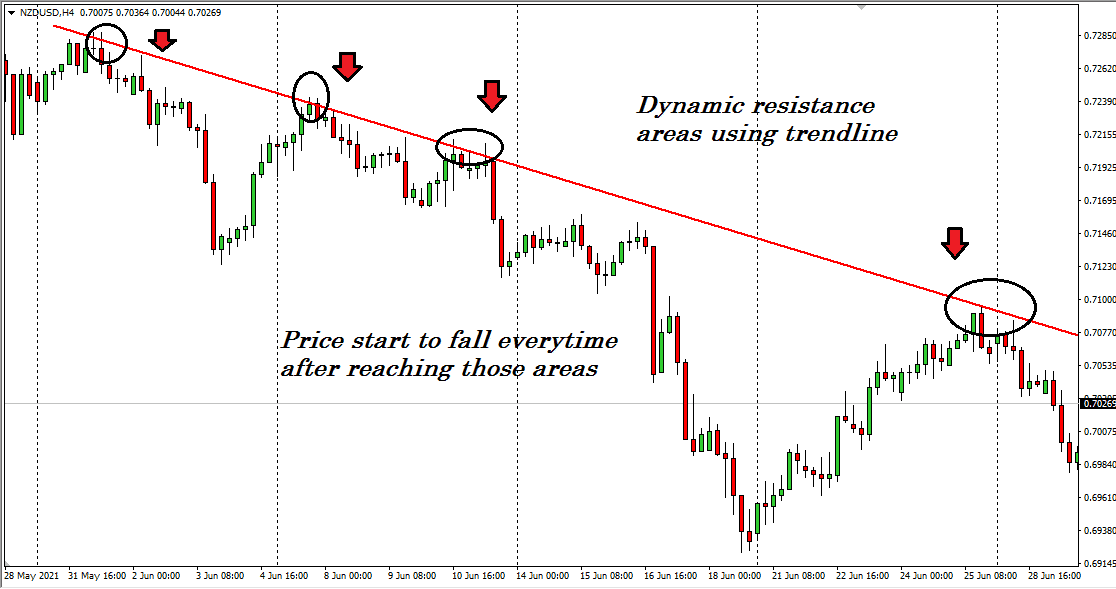
The figure above is a 4-hour chart of NZD/USD that identifies resistance areas of a downtrend price movement by using a trendline. Every time the price reaches that area, it starts to fall back to the downside.
- Using Fibonacci retracement
This tool is a standard that professionals and price action traders use to determine possible reversal areas at the price movement. Using Fibonacci retracement is easy. Identify the recent bullish or bearish trends and set this tool at the higher and lower levels of that trend.
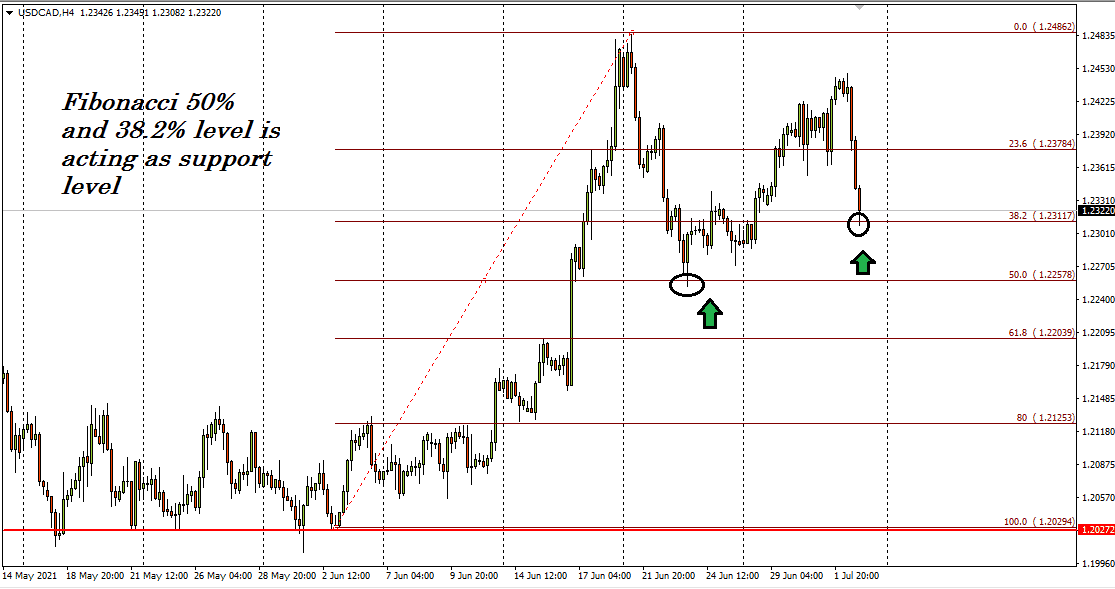
The figure above shows the effectiveness of Fibonacci retracement levels at the 4-hour chart of USD/CAD.
- Using indicators
FX traders often use technical indicators like MA’s to sort out S/R areas. Another tool, Ichimoku cloud, is also popular among traders to identify these areas.
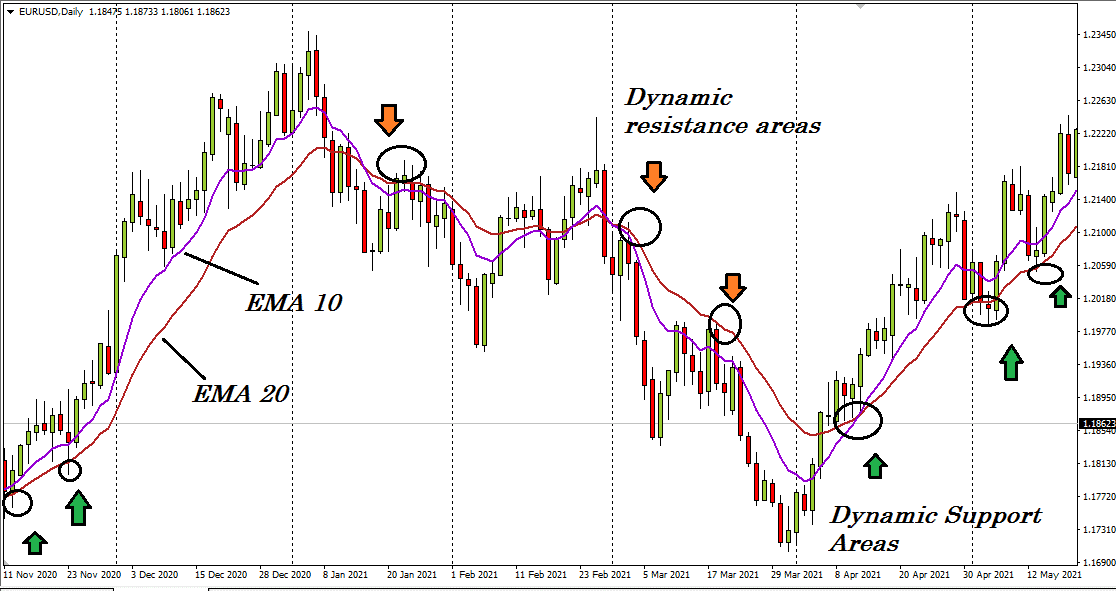
The figure above shows EMA 10 and EMA 20 lines on the daily chart of EUR/USD. When bullish pressure comes up, the EMA 10 or blue line crosses above the EMA 20 or red line and vice versa.
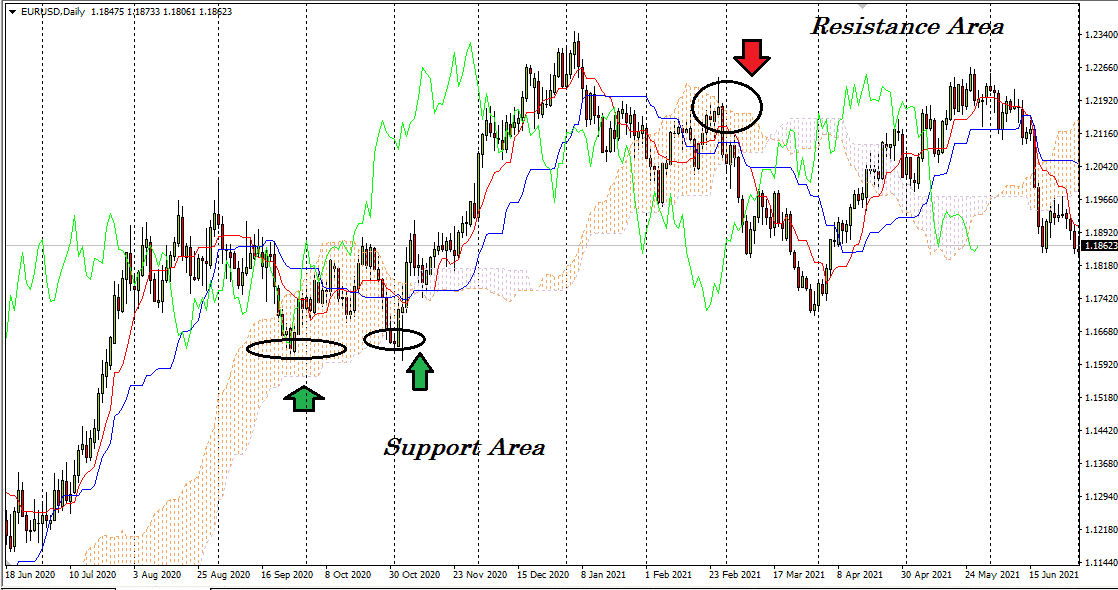
The figure above shows identifying S/R areas using the Ichimoku cloud indicator.
Event level vs. dynamic level: a critical comparison
The event level is a static level that works as both S/R. Price starts to change direction from those levels. On the other hand, dynamic levels are indicators that move with the price and provide S/R.
The best part of event-level is that it can generate both buying and selling possibilities to the chart. On the other hand, dynamic levels change with the price and work well when the price moves in a strong trend.
Traders can spot and use event levels in the naked eye, while dynamic levels require adding indicators like Ma’s. The effectiveness of dynamic levels becomes obsolete when the price moves beyond the level.
How to manage trades in S/R trading?
Now we know the best methods to define S/R areas of our chart. So let’s discuss managing trades by using this concept. The rules to keep in mind first always remember the price touches any S/R levels several times, so the levels become weaker.
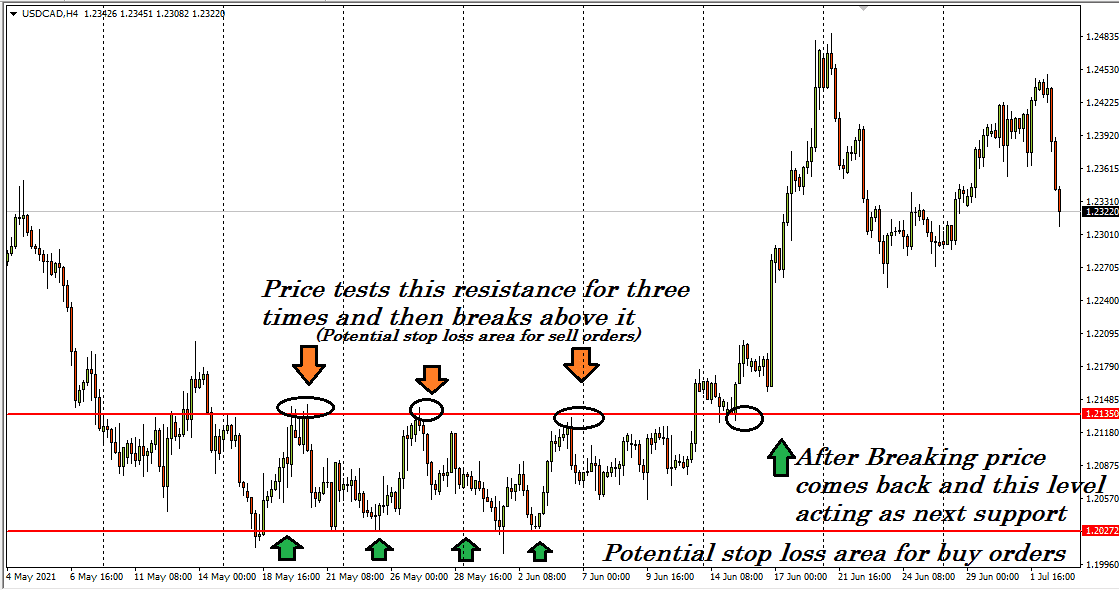
For explanation, the price reaches those levels as more buying or selling interest comes up by the participants. Another rule is S/R is not a thick line, more likely an area.
Often newcomers lose money to trade as they put orders before the price reaches a certain level. In that case, the price may break the area and take out their stop losses (SL). So use comprehensive SL and wait for the confirmation before putting any order.
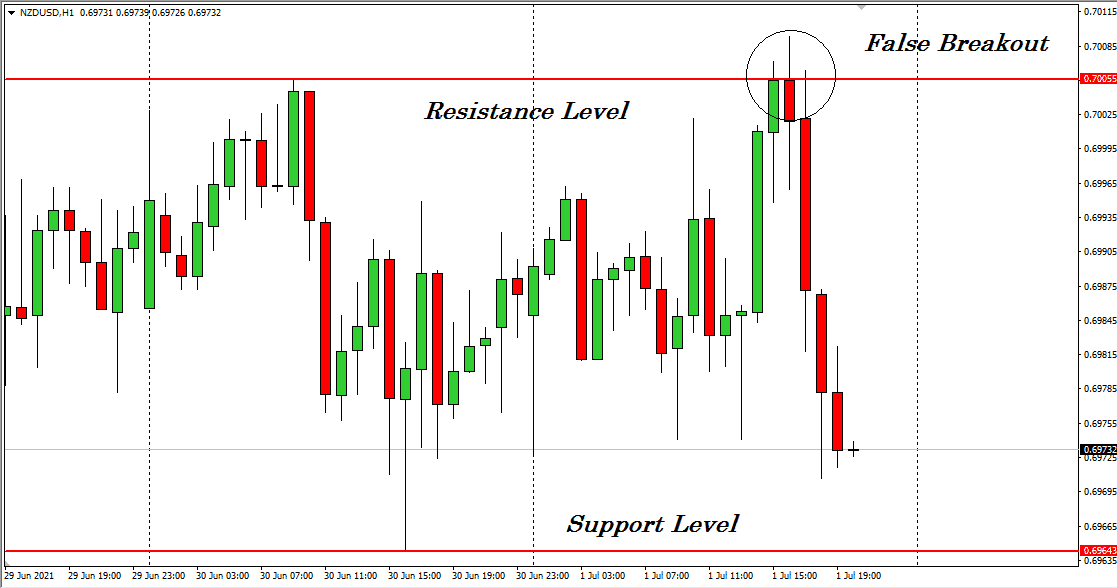
Lastly, as S/R are areas, so some fake breakout occurs. Be aware of those fakeouts.
Final thoughts
Finally, the concept of S/R is not as easy as it seems. We suggest doing more practice and research about this method before applying it to your live trading chart. Mastering this concept can increase your profitability. We discourage doing emotional trading and use proper money and trade management.
