Stock market analyst Marc Chaikin introduced the Chaikin Money Flow Indicator. It’s a hi-tech analysis indicator used to measure the money flow volume over a specific period. The Chaikin Oscillator and the accumulation/distribution are the indicators of CMF.
Marc Chaikin also introduced the term money flow volume. It’s not a single tool because it’s used as a mathematical expression to construct other indicators. It’s used to measure the money in and out of a security over a set period.
The time frame is 20 periods for the standard CMF tool. A 20-day plotting on the chart represents one month’s worth of trading days. CMF is an effective tool for validating trend direction, measuring a trend strength, or identifying potential trend breakouts.
CMF value lies between 1 and -1.
- When CMF is nearing -1, the selling pressure is higher.
- When CMF is catching up on +1, the buying pressure is higher.
Let’s get into the trading strategies of this indicator.
What is the Chaikin Money Flow Trading strategy?

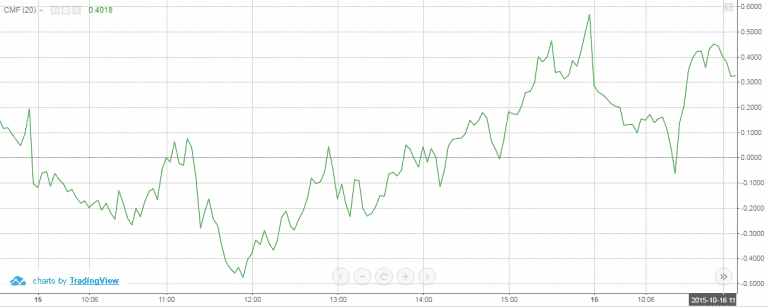
As you can see in the image taken by the trading platform, the Chaikin tool consists of a curved line oscillating above and below a zero line. CMF is programmable. Thus, it allows the traders to scale up their needs through customizing.
The CMF tool represents a bearish move in the market when it turns red and a significant upsurge when it turns green. It usually lies between -0.5 to 0.5 level as it rarely reaches the level of -1 to 1. CMF is used to confirm the trend strength behind an uptrend or a downtrend.
Crossing over the zero line
The everyday use of the tool is to get the signals when it starts fluctuating between the zero level. When the indicator’s signal exceeds zero, a buy signal is generated. Conversely, when it indicates zero, a sell signal is generated.
On a lighter note, the indicator sometimes prefers inaccurate signals, too, so it would be better for the trader to check it through other tools too.
A clever way to filter out the choppiness from the zero level is to plot the -0.5 and 0.5 levels. Reading below or above 0.5 indicates a strong trend and positions. However, a minor error can be expected.
Divergence trading in CMF
The price action is different from the evolution in CMF when there is divergence. The indicator may also detect divergences in the trade. When the CMF makes a higher-high or a price action makes a lower-low, divergences show up.
In short, it means that the market propulsion isn’t reflected in the prices. Sadly, many traders suggest trading divergences in a completely wrong way. They set their foot into the market blindly, without any constructive research.
Moving average strategy in CMF
For smoothing the signals, traders should add a moving average on their tool. A crossover catches good signals when markets are trendings. A long-term moving average added in Chaikin is better than the short ones. But in some cases, the long term produces false signals too.
How to trade with the Chaikin Money Flow indicator?
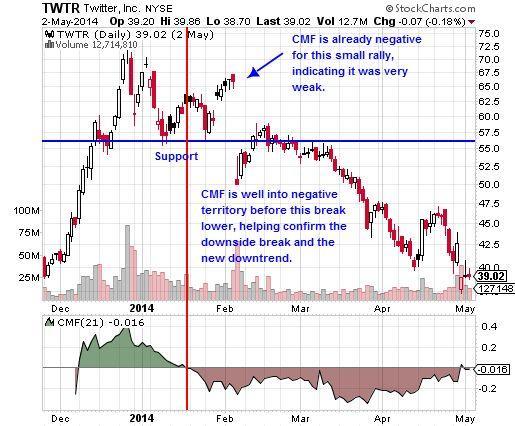
One of the main ways to check the breakouts is the CMF indicator. Insulate the support area where the price fluctuates above or below in numerous attempts. Note these areas of resistance.
When the price rises through resistance, look for the CMF to ensure the breakout. When the price falls through support, look for the CMF below zero to confirm the flight. It isn’t it is probable to lose.

A CMF value above zero is a sign of strength in the market, or below? The zero can be expected as a sign of weakness in a market.
Bearish trading setup
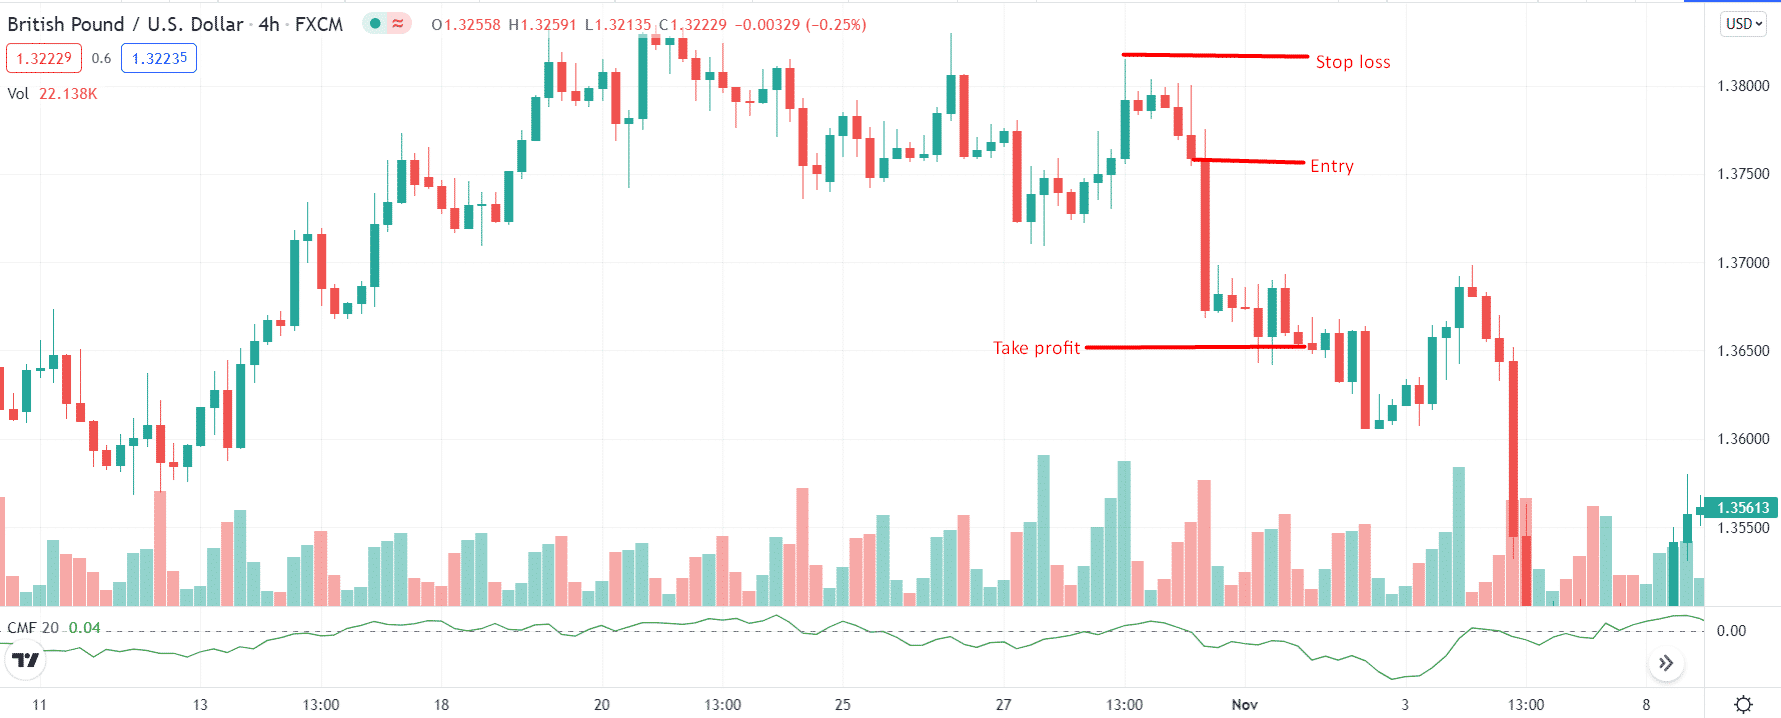
Let’s get acquainted with the CMF bearish trading setup. Read the chart illustration below.

Entry
Get charged when the CMF line crosses below the zero line. Enter the short trade as you are a bearish candle being closed.
Stop loss
Check out the swing high or horizontal level on the upside. Place your SL around the area. As a consrvative trader, you may put the SL slightly above the rejection level.
Take profit
Check the distance between entry price and stop loss. Your take profit should be twice the SL.
Bullish trading setup
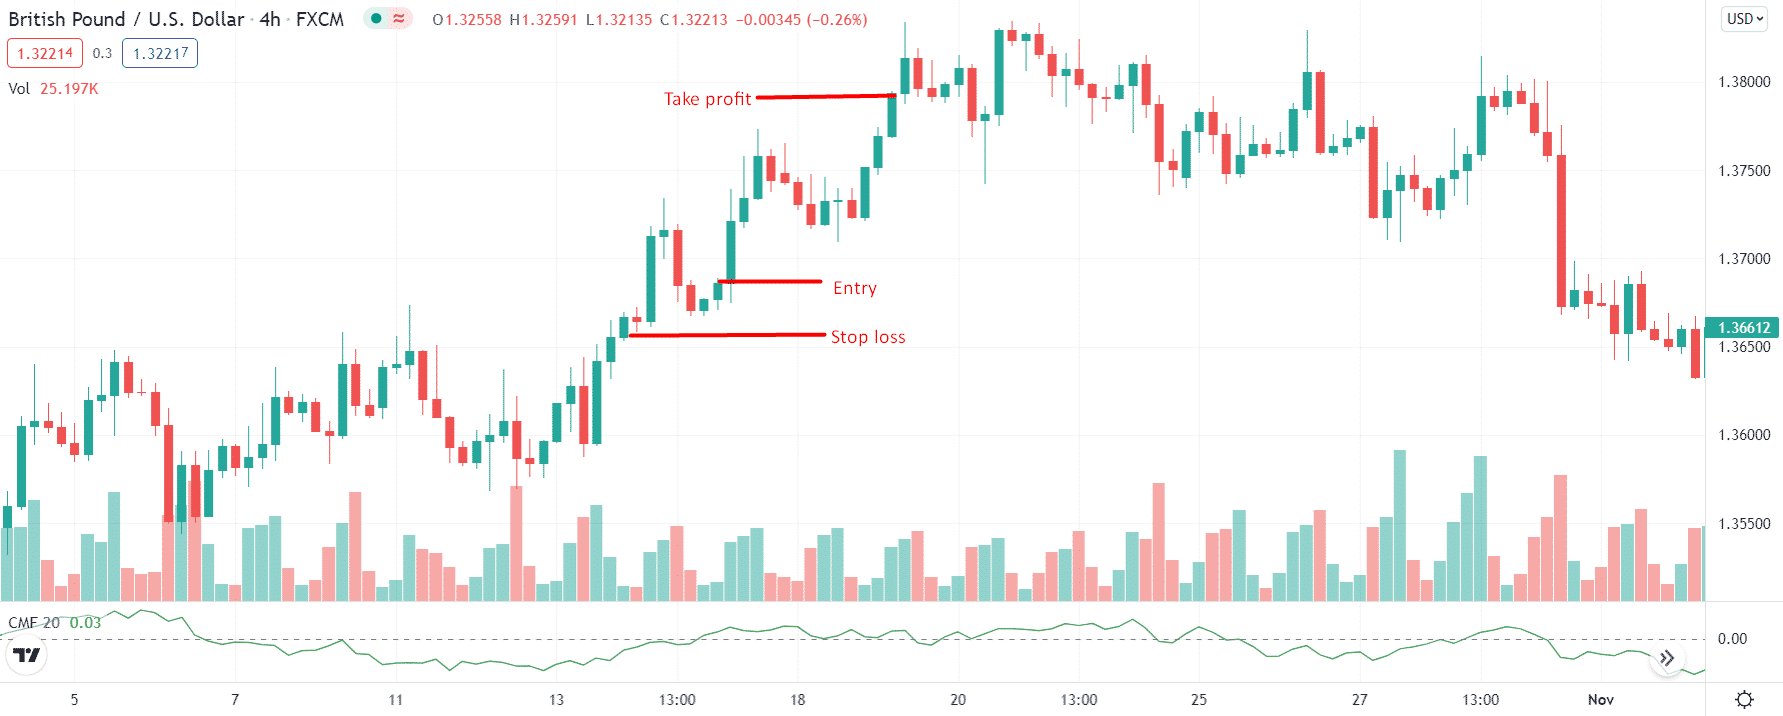
If you have got a glimpse of CMF bullish setup, learning bullish setup will be as easy as a cake pie. Look at the below illustration.

Entry
As you see the CMF line moving above the zero line, enter the long trade. Remember, the entry must be on a bullish candle.
Stop loss
Look for a demand zone below the entry price. Your stop loss needs to be around the demand zone.
Take profit
The take profit should be twice the SL.
How to manage risk while trading with CMF?
Most probably, the signals oscillating in zero levels can be considered as false signals. As described earlier, it’s a more innovative way to plot between -0.5 to 0.5 because it will be easy to filter out the choppiness at that level. Or a trader should add a moving average on the tools to detect good signals, but if you don’t want to lose a penny, make sure to check the signals through another indicator.
Final thoughts
Every trading has its pros and cons, but the market participant is the one who can differentiate wisely between the benefits and drawbacks. If you’re a trader, you should be aware of investing ways. Strategies indicate you’re willing to invest in CMF trading. Check out all the indicators with their cons and benefits, then invest carefully.


