It’s fair to say that the rhyme “the trend is your friend” has a good deal of logic behind it. You maximize your potential profits when you trade in the direction of a strong trend.
As a general rule, traders and investors know that detecting and trading in the direction of solid trends is a good strategy with minimal risk exposure. It has become one of the most popular indicators among traders of all levels for this reason. In terms of function, it can identify the prevailing conditions in the market.
A trader can quickly determine if a market is trending or ranging and apply the appropriate trading strategy accordingly. It is one of the trend-following indicators. It is similar to the Parabolic SAR, envelopes, moving averages, and other technical analysis indicators. Learn more about it below.
What is an ADX?
The Average Directional Index indicates the strength of a trend comprehensively. Therefore, letting the market move toward a strong movement can significantly increase the chances of profiting and reduce the risks.
Developed by Weels Wilder for daily commodity charts, the indicator helps identify trends in various markets by technical traders and financial experts.
Average Directional Movement Index is a non-directional indicator used to measure trends regardless of price direction.
The Average Directional Movement System’s components are the DMI+ and DMI- indicators, which measure positive and negative price movement strength. There is only one ADX line, which ranges from 0 to 100. Adaptive moving averages are calculated based on the two-directional movement indicator (DMI) lines.
Top five tips for trading Average Directional Index
Following are some valuable tips for the crypto traders about the utilization of the Average Directional Index.
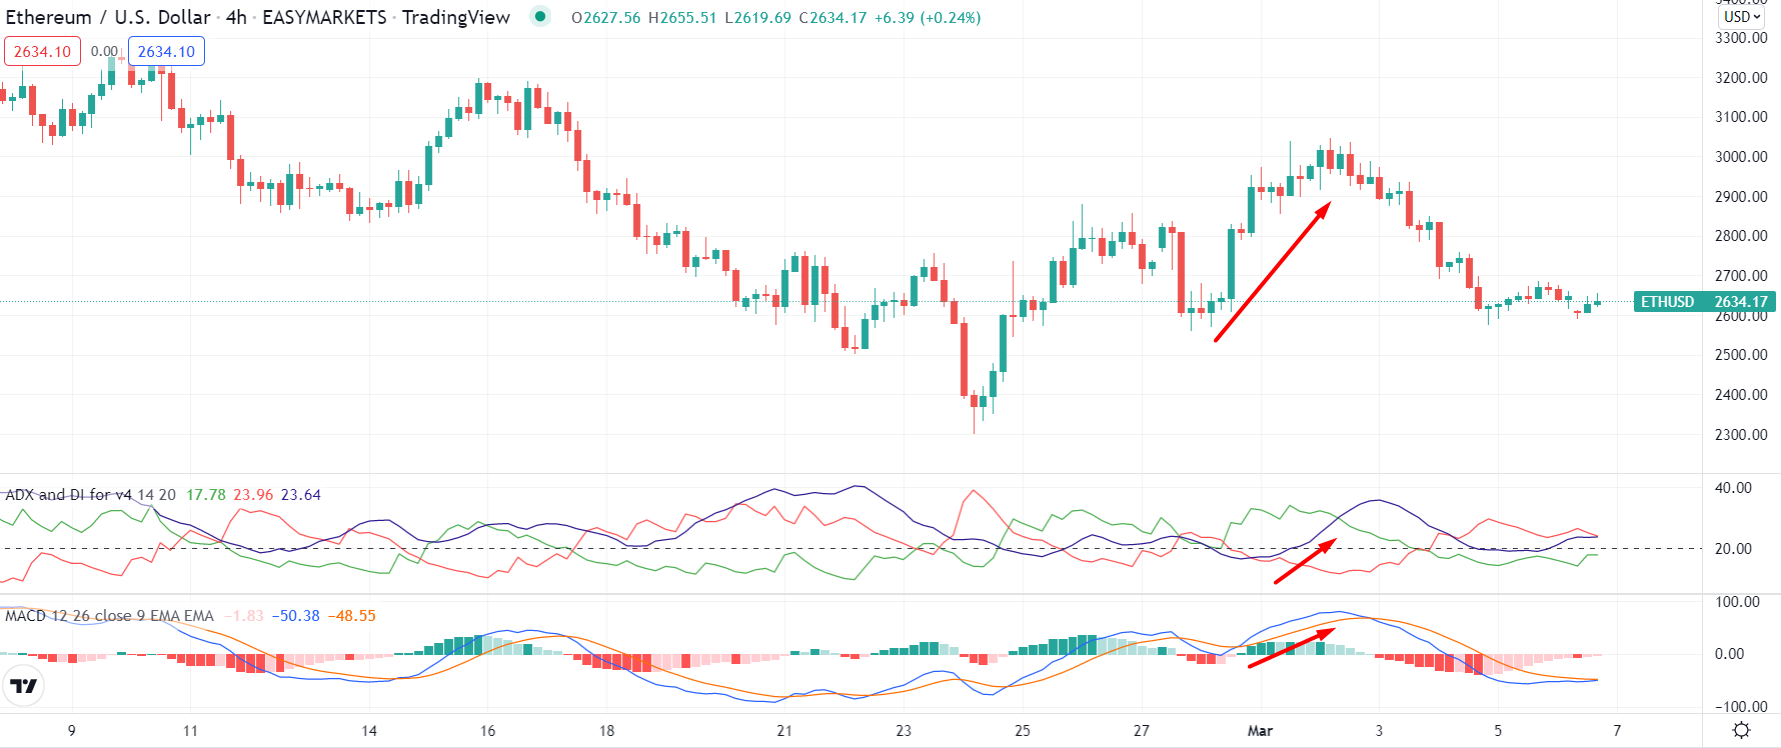
Tip 1. Use it with MACD
The first step in opening a position is to analyze its activity for period 16. Next, ensure the settings for the indicator are correct when adding it to your trading terminal.
Why does it happen?
As with “classic” signals, the signals in this strategy are not unique. A cross between +Di and -Di, for example, signifies a buy signal, and a cross between -Di and +Di represents a sell signal. The traders claim that a crossing of +Di and -Di already allows entry into the market.

How to avoid the mistake?
The MACD oscillator is one of the most popular and widespread oscillators. Typically, it determines divergences. Still, in our case, it only matters whether the histogram is above or below zero since the histogram acts as a filter to open signals. An upward trend indicates an upward trend, and a downward trend shows a downward trend.
You can work by the strategy by setting the MACD for 3, 9, 16.
Tip 2. Buying breakouts
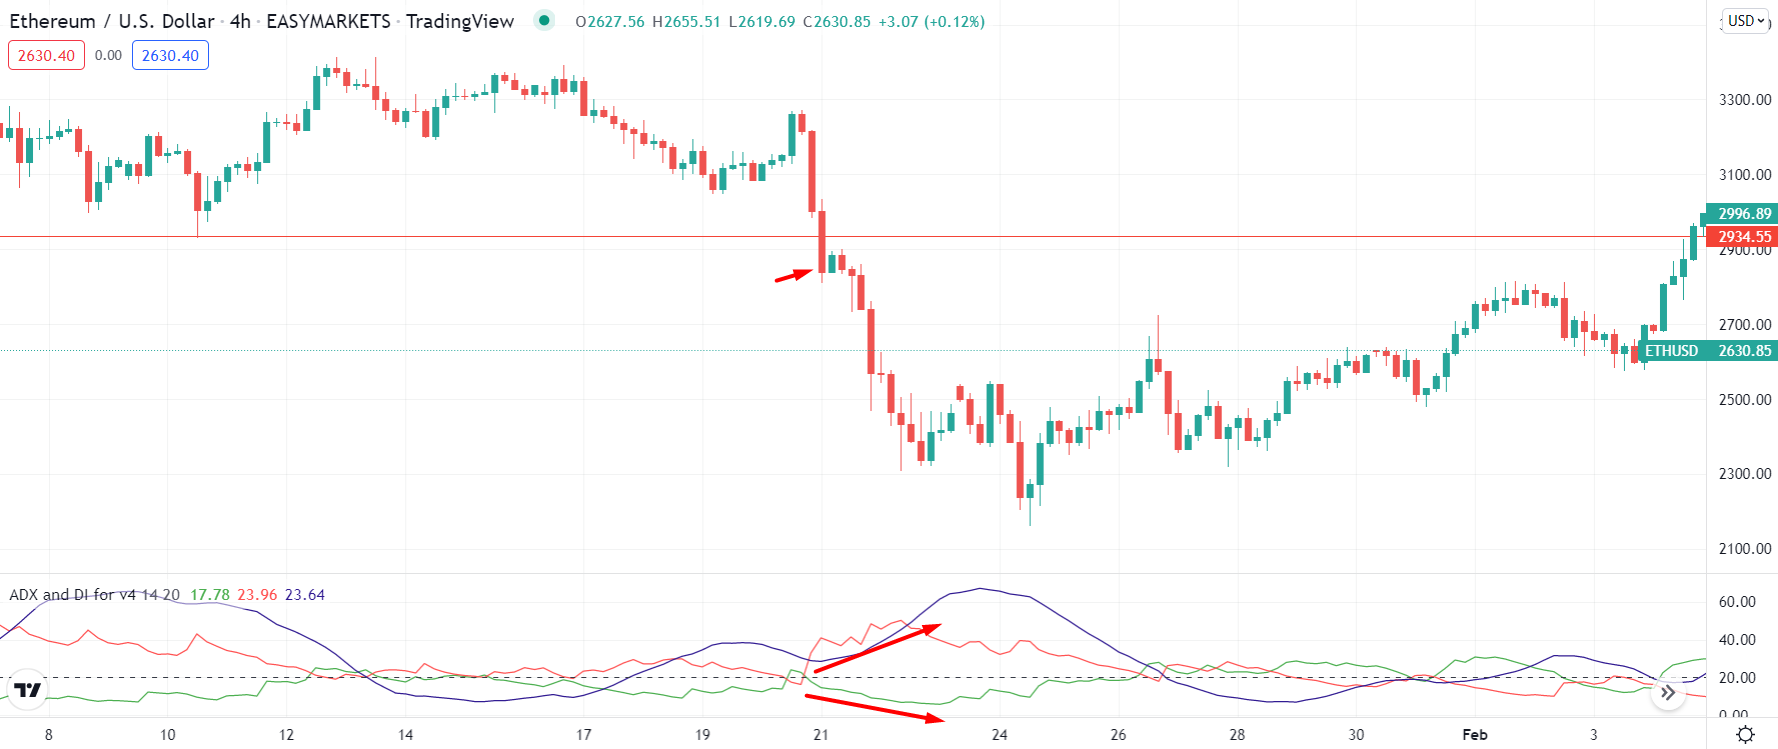
If the price appears to break out but then fails, along can become trapped and have a negative return. By using this indicator, a trader can determine the strength of the breakout and increase the likelihood of a successful trade.
Why does it happen?
It is used in trending markets to indicate trend strength (blue line at the bottom of the chart). The indicator can also serve as a breakout indicator. The price strength is muscular enough for a trend when it reaches or exceeds 25.

How to avoid the mistake?
The price chart below shows a weekly consolidation pattern for over two years. We can draw a descending resistance line for the pattern’s pivot highs. It represents the point when sellers step in to force prices downward. It signifies that the buying has overcome the selling when the price crosses the line.
Towards the end of September, a price breakthrough in the DRL took place. After rising above 25 levels, it continued to climb. ADX now stands at 45, which indicates strength. There is only one ADX peak above its class in the pattern, and that is the +ADX peak that occurred just before the price entered consolidation. The stock shows “new” strength (buying) in this way.
Tip 3. Use of divergence strategy
This leads to a general idea that it will rise with it as the trend develops. Alternatively, if it happens the other way around, you have a divergence.
Why does it happen?
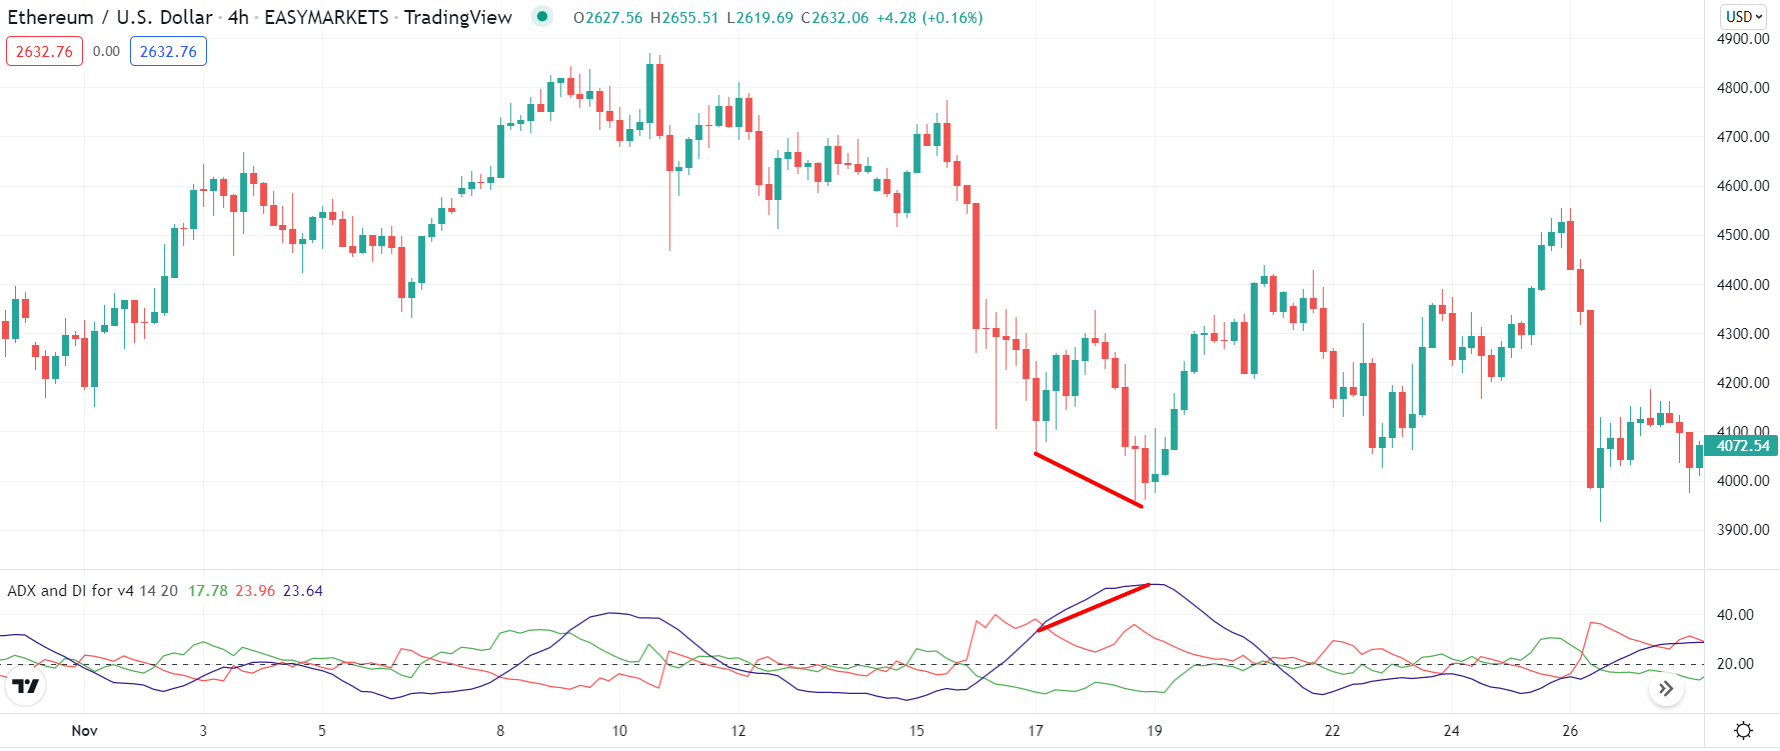
Divergences occur when a higher high occurs on the instrument, while the ADX makes a lower high. A reversal signal isn’t necessarily present here; instead, the warning is that the trend is changing.

How to avoid the mistake?
Divergences refer to trend consolidation, corrections, reversals, or continuations. Unfortunately, it doesn’t help much.
As a result, you should tighten your stop-loss and watch other indicators for signals. If you can’t predict how a market will develop, it might even make sense to close your positions and take your profits.
A divergence signal generated by the ADX is quite similar to a signal produced by oscillators like the MACD and RSI.
Tip 4. By identifying ranges
A key to successful trading is catching the moment when a trend shifts into a ranging pattern. In this regard, the ADX is a powerful tool.
Why does it happen?
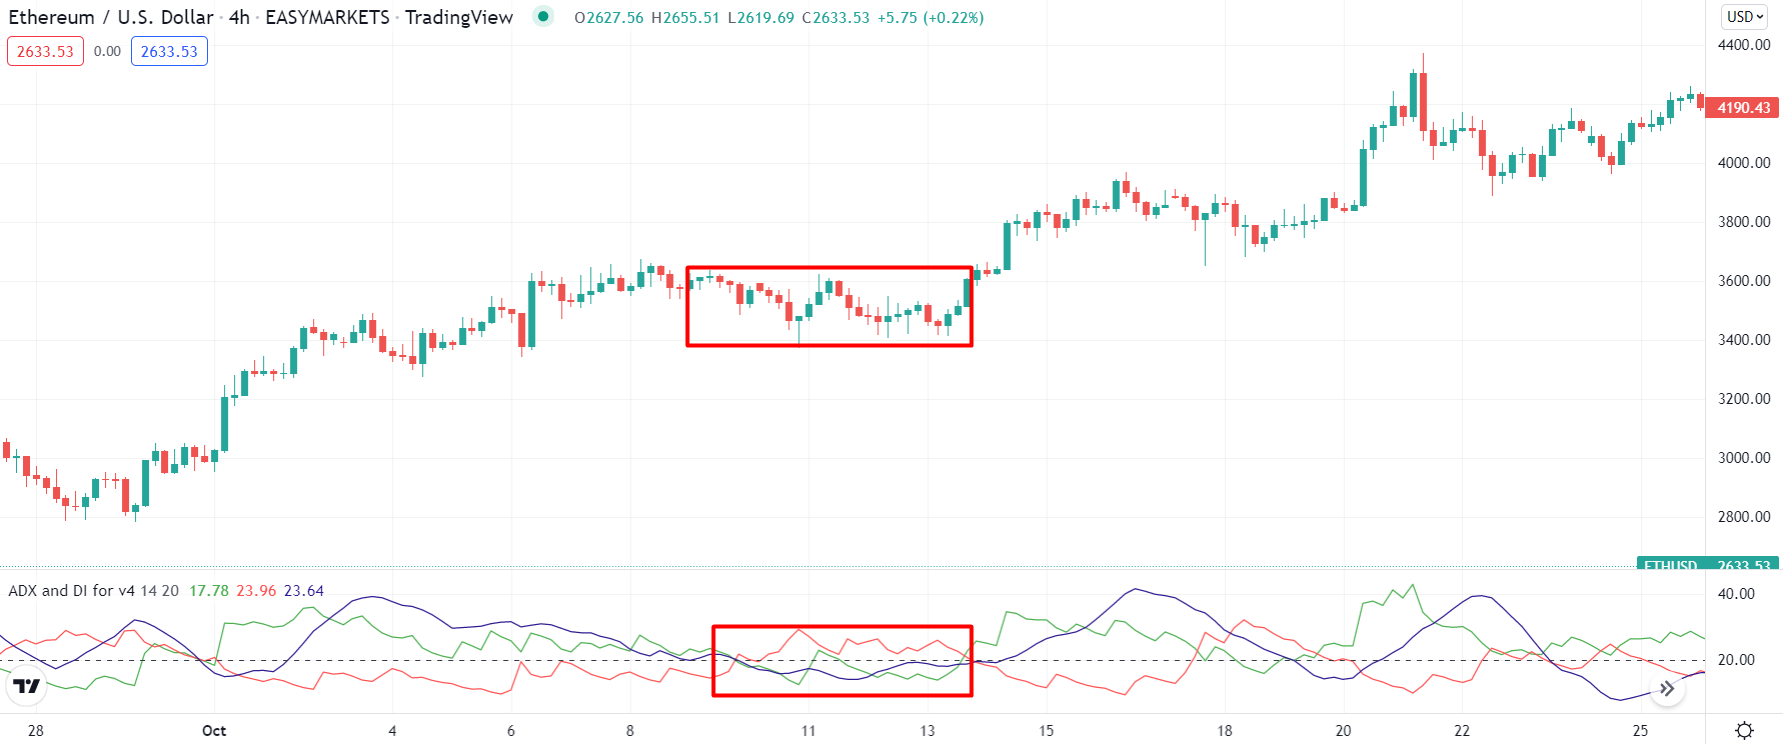
An indicator that drops below 25 but doesn’t exceed 20 is a common sign that the market ranges. If, on the other hand, the trend slows down, but is not yet weak, then this is also considered a weak trend.
The market is calm or ranging sideways, and neither buyers/sellers dominate it. Nevertheless, the market will break the range when the supply-to-demand ratio changes.

How to avoid the mistake?
You should keep calm and refrain from following trends during ranging markets. In case of a reversal, you can proceed with buying/selling. Traders who see a reverse around the support line are encouraged to go long, while traders who know a knock around the resistance line are encouraged to go short.
Tip 5. Pairing with RSI
When you want to use ADX insights to improve your trade timing, on the other hand, the RSI is a great complement.
Why does it happen?
By detecting the right time to open a position, the RSI can help you maximize your profit potential and bring much-needed precision to your trading strategy. The ADX reflects trends’ intensity, while the RSI enables you to identify trends’ direction.
How to avoid the mistake?
You should confirm your insights across all of your tools regardless of which momentum and trend indicators you choose to use in your trading strategy.
Final thoughts
Traders should trade strong trends and avoid range conditions to make the best profits. The tool indicates trending conditions and helps traders determine the most vital trends to trade. Quantifying trend strength gives traders a significant advantage. The ADX indicates range conditions, so a trader doesn’t get trapped trying to trade in sideways market conditions.
Moreover, it shows when the price has broken out of a range with sufficient force to use a trend-trading strategy. Furthermore, it alerts traders to changes in trend momentum, which allows them to address risk management. It is best not to let ADX become a stranger if you want this trend to remain your friend.


