A parabolic stop-and-reversal system often referred to as Parabolic SAR was first coined by J. Welles Wilder back in 1978. He explains how price movements help in trailing stop-loss and then minimizing risk and eventually maximizing returns.
PSAR also indicates when a trend changes its direction and starts for a reversal. Thus, be it bullish or bearish, we can identify clear signals and manage our trades.
How to identify a signal on the PSAR?
We can identify the signals from the chart below.
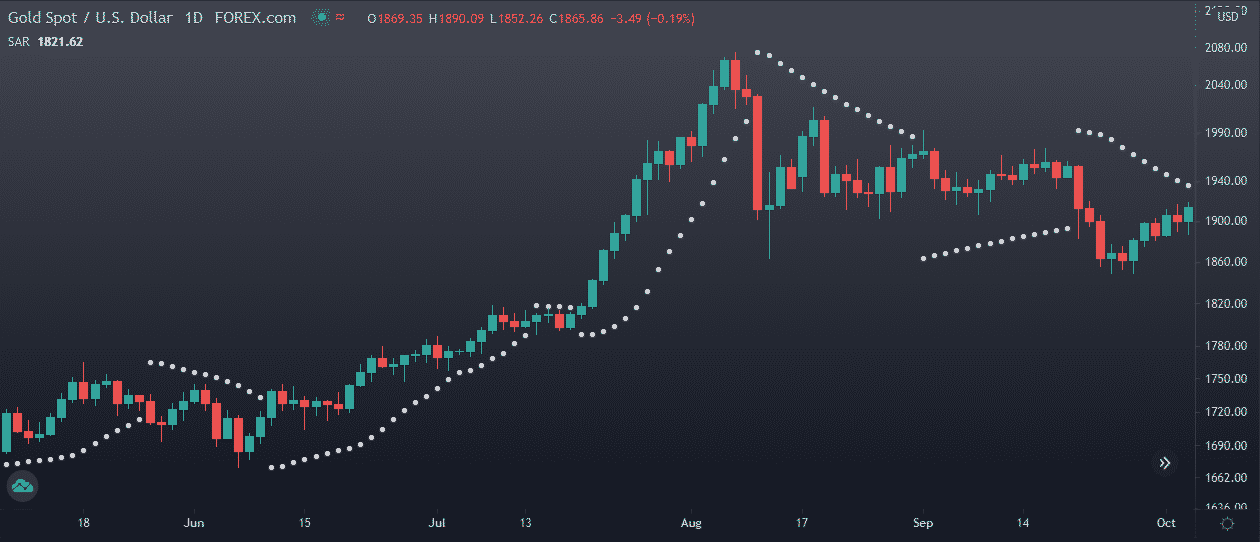
There are white dots near the highs, and the lows of each of the candles called Parabolic SAR. These are the indicators of stop-loss levels and the reversal levels. These dots are underneath the candle during a bullish phase (uptrend), whereas above the candle during a bearish phase (downtrend).
Welles Wilder prescribes using it following the higher time frame. Herein, we will enjoy the trend following and save ourselves during corrections. Thus, the most crucial phase in technical analysis, “a trend is our friend…” is justified with this indicator’s signals.
The continuation of the saying “…until it bends on the other end” is being saved by our stop-loss levels.
How to calculate and obtain the levels of PSAR?
There are some hefty calculations for the Parabolic SAR indicator, but easy to understand in text.
The formula needs:
- The highest prices in a swing
- The lowest prices in a swing
- The acceleration factor which will help in trailing of stop-loss
We get the PSAR dots by calculations as follows:
Bullish Parabolic SAR = Prior SAR + Prior AF (Prior EP – Prior SAR)
Bearish Parabolic SAR = Prior SAR – Prior AF (Prior SAR – Prior EP)
EP — the extreme point in a trend, i.e., the highest high of an uptrend and the lowest low of a downtrend.
AF — the acceleration factor, essential for trailing stop-loss level and giving a possible reversal level.
Thus, we get a price level on calculating each of them, unique for each candle, usually dotted or inline chart format, ready to be used as an indicator. Plotted near the highest highs and the lowest lows as the case may be.
What are the input setups required for this indicator?
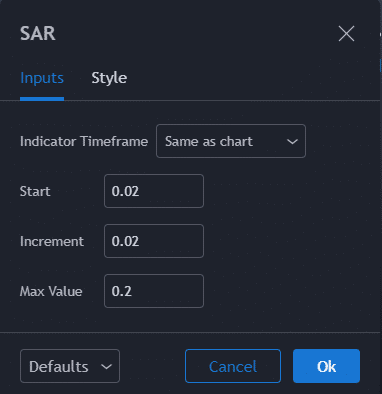
The indicator has three primary inputs:
Start
It is the “steps” value, which will begin from 0.02.
Increment
Also, the acceleration factor multiplied with the difference between Prior SAR and the extreme points of the trend. The increment in the step. The constant at 0.02 meaning that the “steps” are increasing in 0.02 gaps.
Maximum value
The maximum possible value of the “steps” could be 0.20. As the prices of the assets increase volatility, the Parabolic SAR dots fluctuate rapidly. As a result, every momentum that falls in the prices will drive the dots flatter, explaining the low probability of trend reversals.
Similarly, every spurious rise in prices would lower the probability of a falling trend.
How to practice trades and earn profits with PSAR
The text was easier to understand than the formulas. Now the application of the indicator on strategies is more accessible than the texts.
How do we call it a strategy?
As a strategy must have a correct:
- Entry point
- Exit point
- Stop-loss level
Thus this strategy provides us with all of these.
We have:
- Buy as price crosses above the PSAR levels
- Sell as price crosses under the PSAR levels
- PSAR levels are treated as stop-loss or trend reversal signals
We start with understanding the image below.
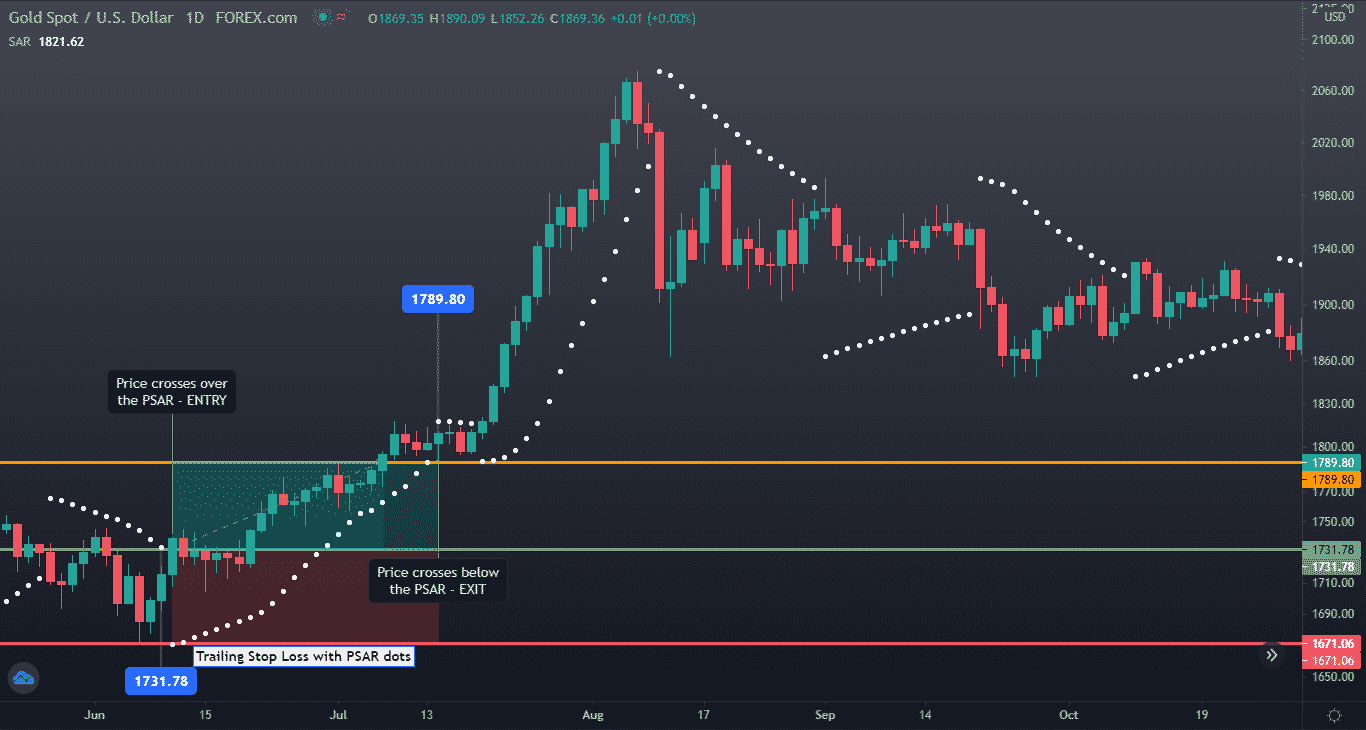
Here we see, as the price crosses above the PSAR dot at 1731.78 levels. Thus there is a buy signal. It is a potential reversal of the previous bearish move, and now the bulls have taken over the bears.
We see the prices run up to 1789.80, and then it crosses below the PSAR dots. So it is a profit booking phase and potential trend reversal, which is based on the fact that the PSAR dots were trailing up with the incrementing steps.
Is the strategy rewarding?
Yes. We later see the following image wherewith a significantly less risk, we generate a massive return.
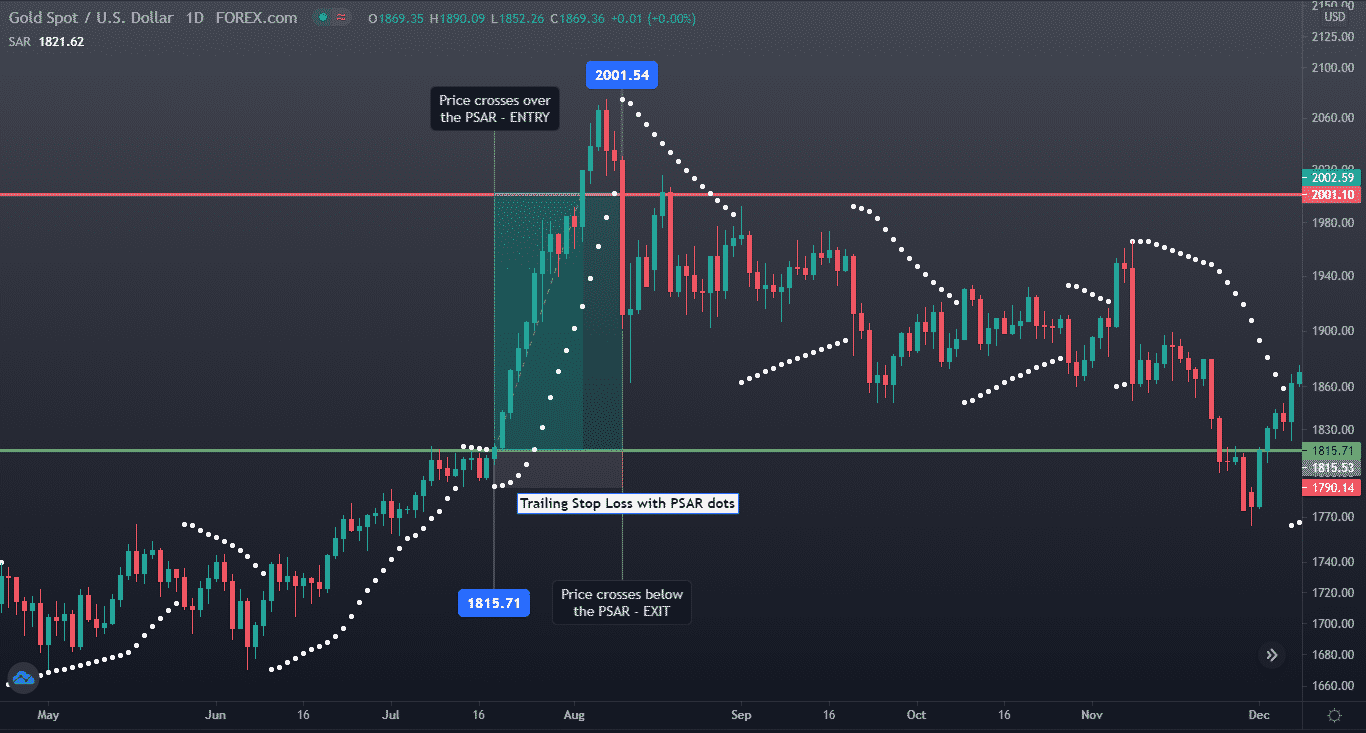
Here we observe that in a brief period, we enter low-risk trade and have a very healthy return.
We entered at 1851.71, where prices crossover the PSAR dots and kept the stop-loss levels at 1790.14. The rally reached 2001 levels, and we booked a significant profit while the prices crossed under the PSAR dots of trailing stop-loss.
Now we will have a glimpse of PSAR strategy on indices.
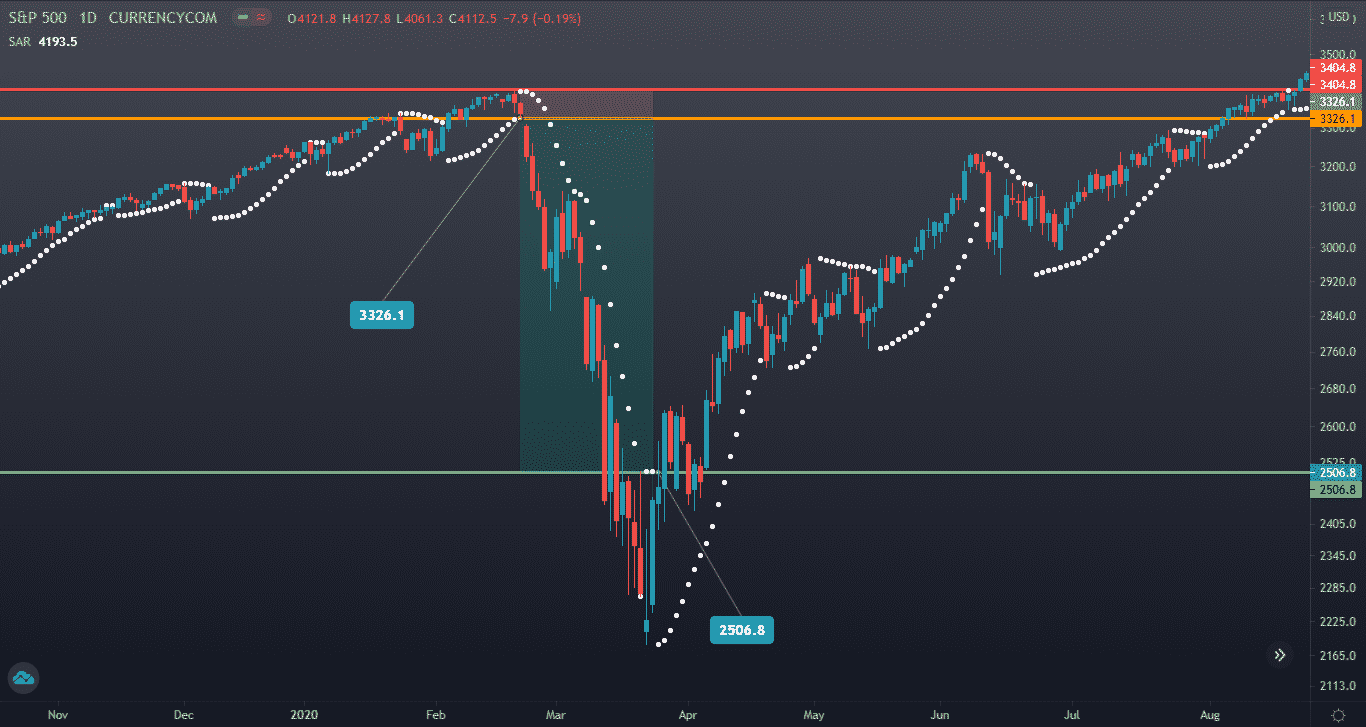
Here we observe, if we would have applied this indicator, we could have protected our wealth from the pandemic crash, and shorting could have given us a tremendous result. This strategy, with the help of its stop-loss levels, could be used for creating wealth.
This indicator helps us to enjoy a large number of profits with a limited amount of risk. As a result, the risk-return ratio is usually very healthy while trading on this indicator.
How to be aware of the pitfalls?
Is this strategy immune to failures? Do we book profits in all the cases when backtested?
None of the strategies are immune to losses. Here also, we might suffer losses when markets fail to run in trends. We see that the prices often hit our stop-loss during the choppy phase of an asset without giving any reasonable return. Thus, using this strategy in a short time frame is a risky job.
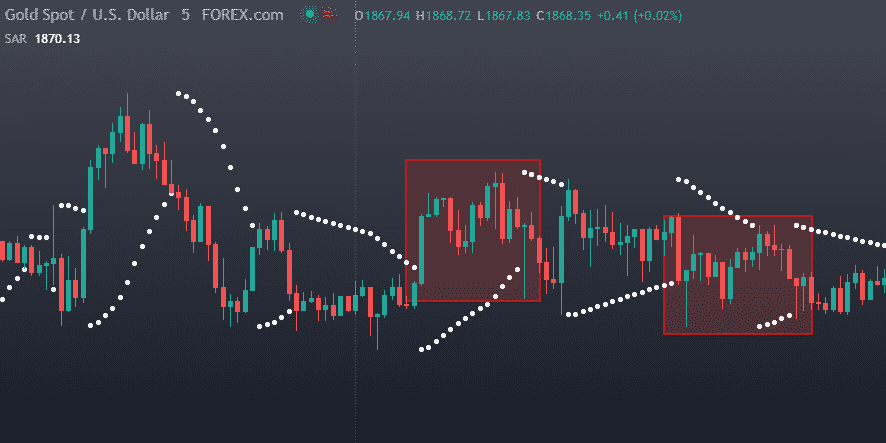
In the picture above, we see that the indicator provides many signals in a brief period.
We observe that most of the trades lead to losses, as we enter the trade after a correction move, and then the prices continue to follow their previous trend. Thus, the dots provide us with a fake reversal signal.
Conclusion
Although all indicators are helpful, it is advised to use Parabolic SAR to understand the trend on a higher timeframe. After understanding the trend, we can join the rally and the movement in a shorter time frame. Keeping a stop-loss level strict and trailing helps traders in wealth preservation.
