Super Smoothed MACD is a unique technical indicator that has a developing purpose to use in crypto assets. The special feature of smoothing price data of this indicator makes this an attractive technical tool to crypto investors as it helps them participate in more profitable trades and ride the trend.
However, knowing the components and calculation procedures is mandatory while seeking to start using any indicator for making successful trade decisions. This article will enlighten the Super Smoothed MACD indicator and the top five tips to implement this technical indicator for successful crypto trading.
What is the Super Smoothed MACD indicator?
The SS MACD is a unique version of MACD that smoothes the price and calculates as the traditional tool. It generates more efficient trading ideas, resulting in an independent window that contains two dynamic signal lines.
At the same time, the conventional MACD has histogram bars of different colors on both sides of a central line alongside two dynamic signal lines. The crossover between these lines suggests trend-changing and direction or continuation.
Top five tips for using SS MACD indicator for crypto strategy
Cryptos are blockchain-based products that are a new addition to the financial market. These digital assets have functionalities like many other financial assets regarding trading or investing. Many investors have already made millions of dollars from this marketplace, making thousands of dollars every month. However, it is mandatory to follow specific guidelines to make constant profits from this marketplace. In the following section, we list the top five tips to use the tool for crypto trading.
Tip 1. When entering a bullish trend
When the price reaches near a finish line of a downtrend or any downtrend loses strength, seek to open a buy position as there is a possibility for trend reversal. The dynamic red line will get above the dynamic blue line of the indicator window as soon as a bullish momentum initiates. It suggests opening a buy position when this type of crossover occurs.
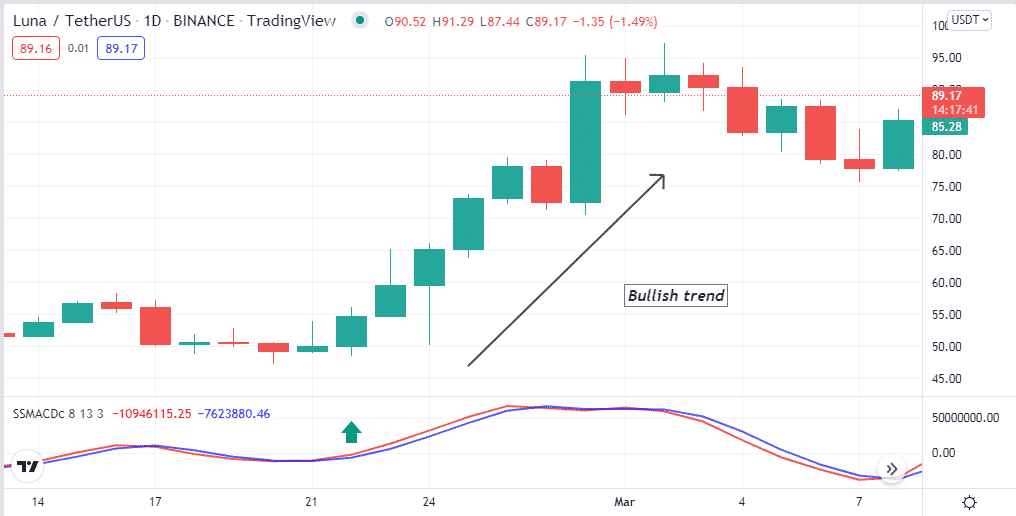
How does this happen?
The indicator uses smoothed asset price data to obtain the market context rather than using the EMA lines (12,26) of different periods as the MACD indicator. It uses values of the Fibonacci series, including 3,8,13, and allows this indicator to generate more adequate trade ideas.
How to avoid mistakes?
The SS MACD indicator generates efficient trade ideas using the concept of the traditional MACD and smoothed price data. When using this indicator to execute short-term trades, it is better to conduct a multi-timeframe analysis to confirm the actual price direction before executing trades.
Tip 2. When entering sell trade
The price reaches near resistance level or at the end of an uptrend enabling buy opportunities for crypto traders. When the price enters a downtrend, the dynamic red line declines below the dynamic blue line of the SS MACD indicator. When this crossover occurs, and both dynamic lines slop on the downside, it enables sell opportunities for crypto traders.
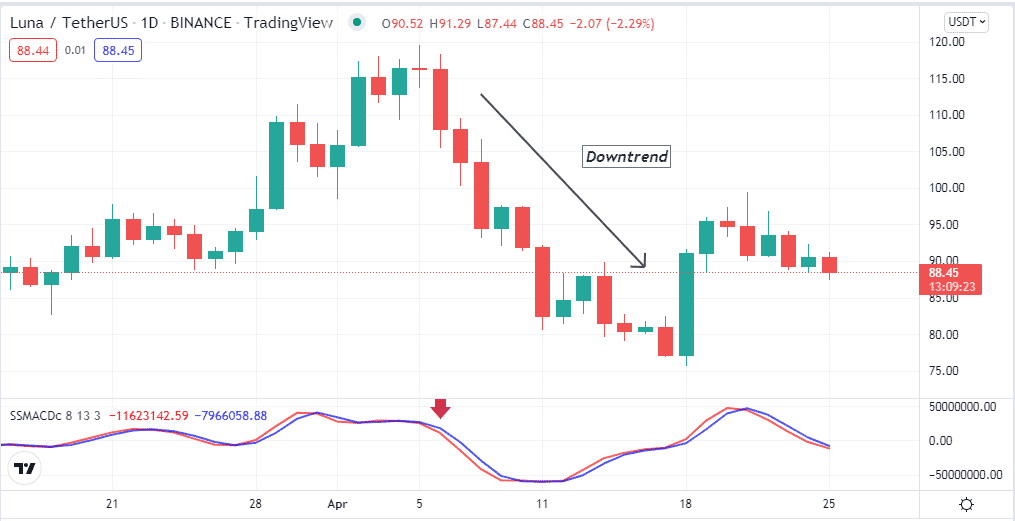
How does this happen?
When the short-term EMA drops below the long-term EMA declares bearish pressure on the asset price.
How to avoid mistakes?
Don’t make an early entry, verify the crossover, and always use adequate trade and money management when using the SS MACD indicator for crypto trading.
Tip 3. Determine the sideways
This tool is an efficient indicator that can determine sideways by two dynamic lines of the indicator window. When the price continues sideways or remains in a consolidating phase, the dynamic lines remain together, and frequent crossover occurs.
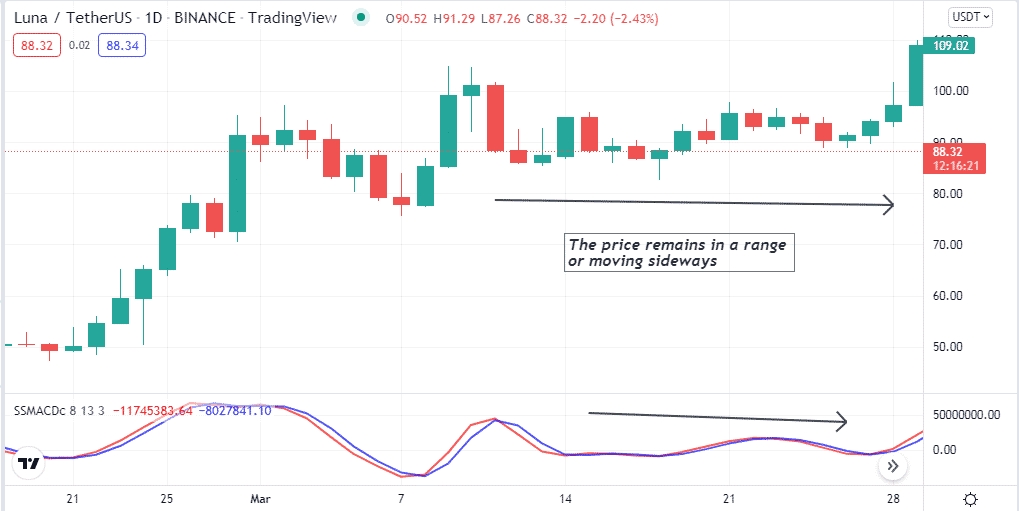
How does this happen?
The price continues sideways when the volume drops or there is indecision among participants, so both the short-term and long-term EMA lines remain together and frequently crossover as the hesitation goes on.
How to avoid mistakes?
The sideways price is not a potential condition to make a considerable profit as there is no specific direction price continues to move ups and downs within a small range. So it is better to avoid these types of situations to enter and wait till a breakout occurs.
Tip 4. Combine the reading with the RSI indicator
To generate trade ideas, you can combine the SS MACD indicator reading with the RSI. For example, check the RSI indicator window when the bullish crossover occurs on the SS MACD indicator. Match that the RSI dynamic line remains near the central line and heads on the upside, declaring bullish pressure and vice versa.
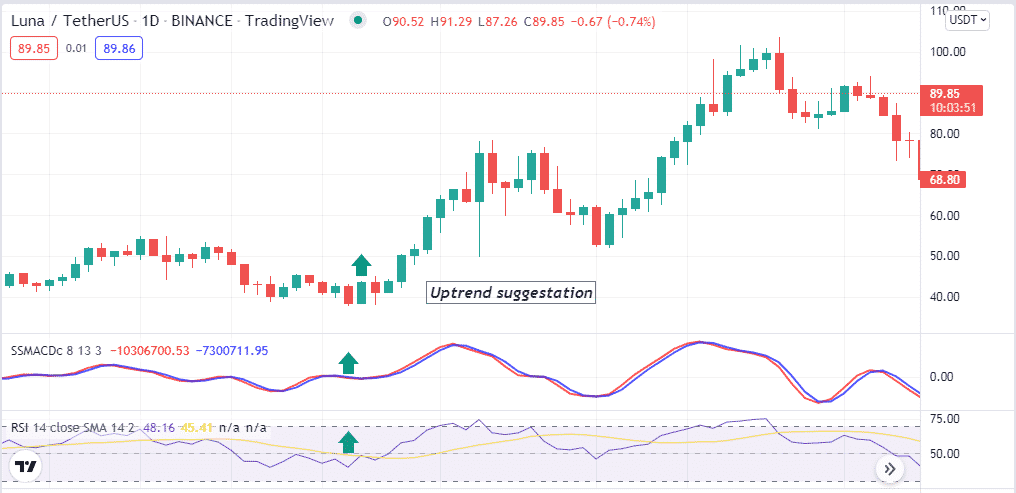
Why does this happen?
When both indicators suggest the price movement in any direction that generates potentially profitable trade suggestions for crypto investors, the RSI indicator is a popular momentum indicator to financial traders that can help you catch more efficient trades.
How to avoid mistakes?
Match both indicators readings carefully when executing any trade; don’t make early entries.
Tip 5. Define breakouts using the ADX indicator
Identifying breakouts helps traders to reduce risks on capital. The price can surge when the volatility decreases, so seek breakouts combining other indicators like ADX to determine trend strengths. For example, the SS MACD indicator suggests initiation of bullish momentum, and the ADX value rises above 20, declaring a possible bullish breakout and vice versa.
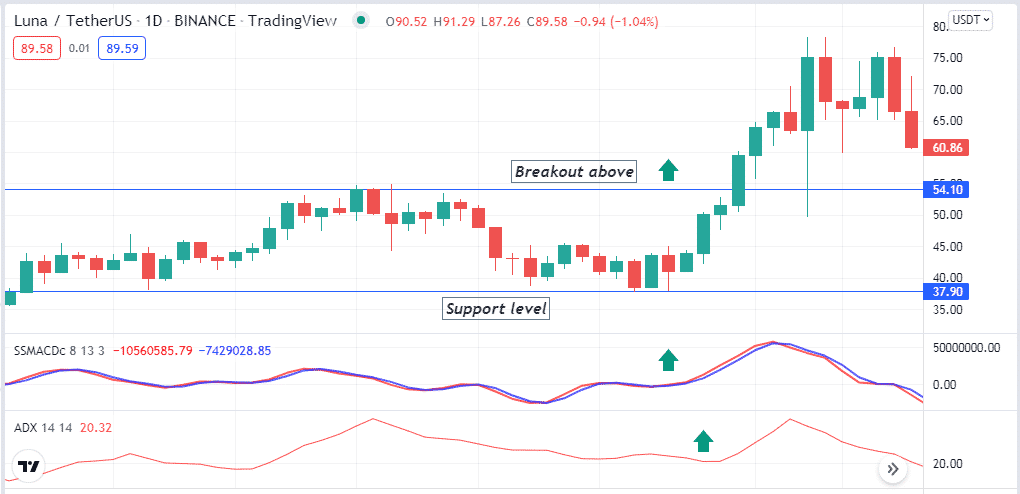
How does this happen?
When a bullish/bearish momentum initiates, measuring the current trend’s strength makes it easier to determine potential breakouts and participate in swing trades.
How to avoid mistakes?
Check the upper time frame charts to confirm the actual price direction if you seek to catch short-term trades. Try combining support resistance data. For example, the price breaks above short-term resistance near a support level, and both indicators suggest bullish momentum indicates opening a buy position.
Final thought
The SS MACD indicator is an updated version of the traditional MACD indicator that calculates the same way by using smoothed price data of trading assets. Master the concept by practicing and following the tips above when executing any trade.


