Using technical indicators to make trade decisions is common practice among financial traders. The super trend indicator is a popular technical tool among market participants. It enables traders to determine the most accurate entry/exit positions by calculating the market context.
However, using indicators for generating trade ideas involves learning the functionality of that indicator. Let’s learn the functionality besides trading strategies using this indicator. Later we list the pros and cons of using this technical tool.
What is the super trend indicator?
A technical indicator defines the trend by plotting lines and different colors. A unique trend following indicator is similar to using the concept of moving averages — a straightforward, easy applying technical indicator that uses two parameters.
When the calculation finds an uptrend, it plots a straight line below price candles, green with price candles. Conversely, a red line above price candles and a red cloud for a downtrend.
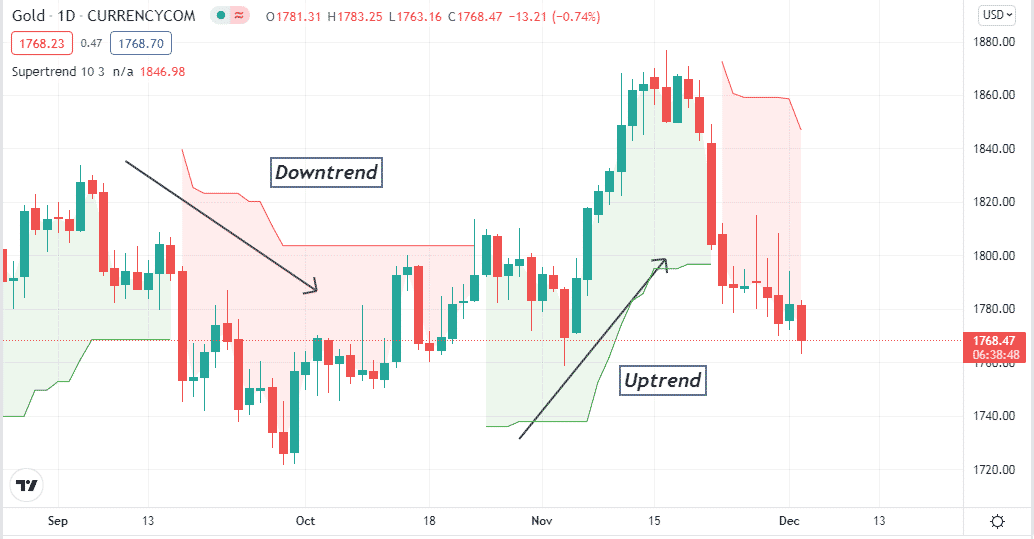
However, the indicator is ineffective as other indicators that identify the trend when it changes phases. It takes some time to change color. So it is best to use other indicators to generate the best trading ideas.
The formula this indicator use is:
Supertrend upper line (red line) = (high + low) / 2 + multiplier × ATR.
Supertrend lower line (green line) = ( high + low) / 2 – multiplier × ATR.
Meanwhile, the ATR indicator use formula:
[(Prior ATR x 13) + Current TR] / 14
So the basic fundamental features of the super trend indicator are:
- It defines different trends.
- Green and red lines are below and above price candles.
- Greenline declares bullish pressure.
- Redline declares bearish pressure.
- The green line also declares the support zone.
- The red line also declares the resistance zone.
How to trade using the super trend indicator?
This tool is a unique and easy applying trend following indicator that suits fine on any trading asset. You can easily open buy positions when it changes to green color and vice versa when it turns red. For best results, market participants use trend or volume indicators such as Parabolic SAR, MACD, RSI, ADX, etc.
A short-term trading strategy
In this short-term trading method, we use another popular momentum indicator, the MACD, besides using the super trend indicator.
The MACD shows reading in an independent window that contains two different signal lines and histogram bars of different colors on both sides of the central line. This trading strategy suits any trading asset; we recommend choosing assets with sufficient volatility and using charts or 15 min or one hour to chart the best potential short-term trades.
Bullish trade scenario
When seeking to open buy positions, apply those indicators on your target asset chart and observe when:
- The dynamic blue signal line crosses above the dynamic red signal line on the MACD window.
- Both signal lines are heading toward the upside.
- MACD green histogram bars take place above the central line.
- The supertrend indicator turns green.
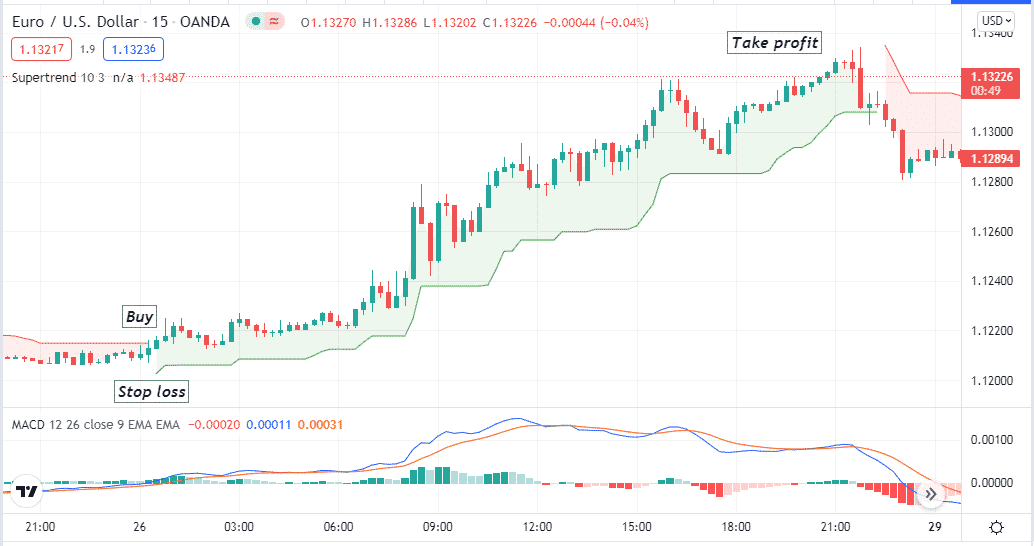
Entry
Open a buy position when these conditions above match your target asset chart.
Stop loss
Your buy order’s initial stop loss level will be below the current swing low.
Take profit
Close the buy position when:
- The dynamic blue line crosses below the dynamic red line of the MACD indicator window.
- MACD red histogram bars take place below the central line.
- The super trend indicator turns red.
Bearish trade scenario
When seeking to open sell positions, apply those indicators on your target asset chart and observe when:
- The dynamic blue signal line crosses below the dynamic red signal line on the MACD window.
- Both signal lines are heading toward the downside.
- MACD red histogram bars take place below the central line.
- The supertrend indicator turns red.
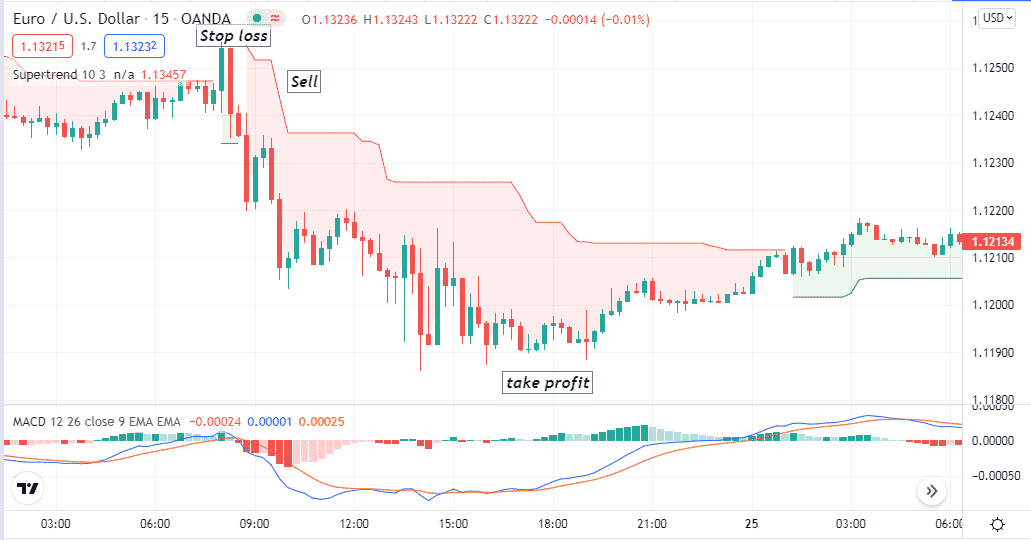
Entry
Open a sell position when these conditions above match your target asset chart.
Stop loss
Your sell order’s initial stop loss level will be above the current swing high.
Take profit
Close the sell position when:
- The dynamic blue line crosses above the dynamic red line of the MACD indicator window.
- MACD green histogram bars take place above the central line.
- The super trend indicator turns green.
A long-term trading strategy
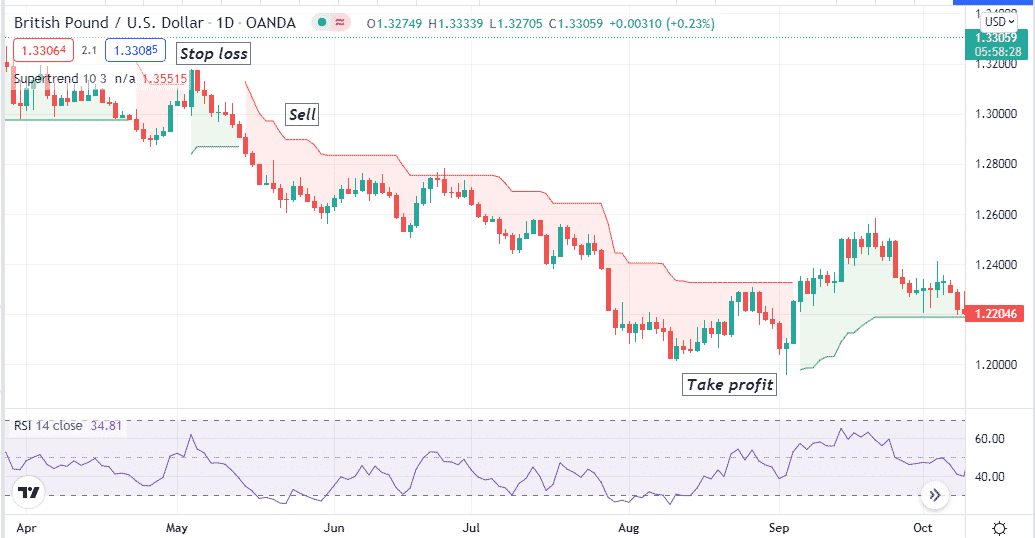
Our long-term trading strategy uses the RSI indicator beside the super trend indicator. The RSI indicator defines trends and the oversold-overbought conditions of the asset price in an independent window through a dynamic signal line and different levels.
The RSI indicator declares an overbought condition when the dynamic line reaches the upper (80) line or above. Conversely, an oversold condition when it reaches the lower (20) line or below. This strategy suits any trading asset. We recommend using an H4 or daily chart to obtain the best results through this trading method.
Bullish trade scenario
Apply those indicators and seek to open buy positions when:
- The dynamic RSI line is at or above the central (50) line heading toward the upper (80) line.
- The super trend indicator becomes green.
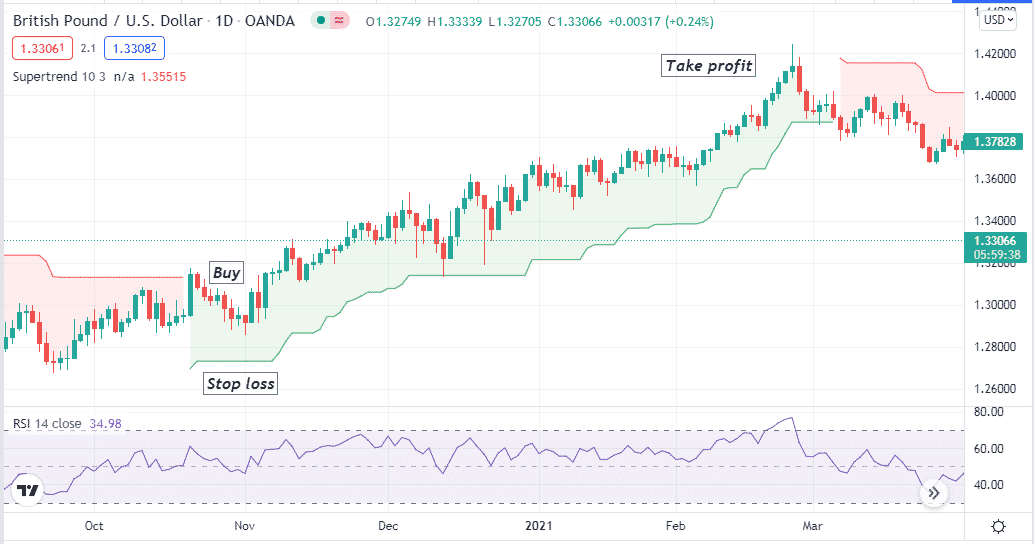
Entry
Match these conditions above with your target asset chart and open a buy position.
Stop loss
Place an initial stop loss below the current swing low for your buy order.
Take profit
Close your buy position when:
- The dynamic blue line of the RSI window starts to head toward the central (50) line after reaching the upper (80) line or above.
- The super trend indicator turns red.
Bearish trade scenario
Apply those indicators and seek to open sell positions when:
- The dynamic RSI line is at or below the central (50) line heading toward the lower (20) line.
- The super trend indicator becomes red.
Entry
Match these conditions above with your target asset chart and open a sell position.
Stop loss
Place an initial stop loss above the current swing high for your buy order.
Take profit
Close your sell position when:
- The dynamic blue line of the RSI window starts to head toward the central (50) line after reaching the lower (20) line or below.
- The super trend indicator turns green.
Pros and cons
| Pros | Cons |
| An easily applicable indicator. | Requires using other indicators to get precious entry/exit positions. |
| It applies to many trading assets. | This indicator can fail due to fundamental events. |
| Allow generating both short-term and long-term trading ideas. | Comparatively slow to identify swing levels or trend shifting points. |
Final thought
This article describes all the primary features of the super trend indicator. You can use these strategies above to trade any trading asset, including currency pairs, stocks, cryptocurrencies, commodities, etc. We recommend using acceptable proper trade and money management concepts while using this indicator to make trade decisions.


