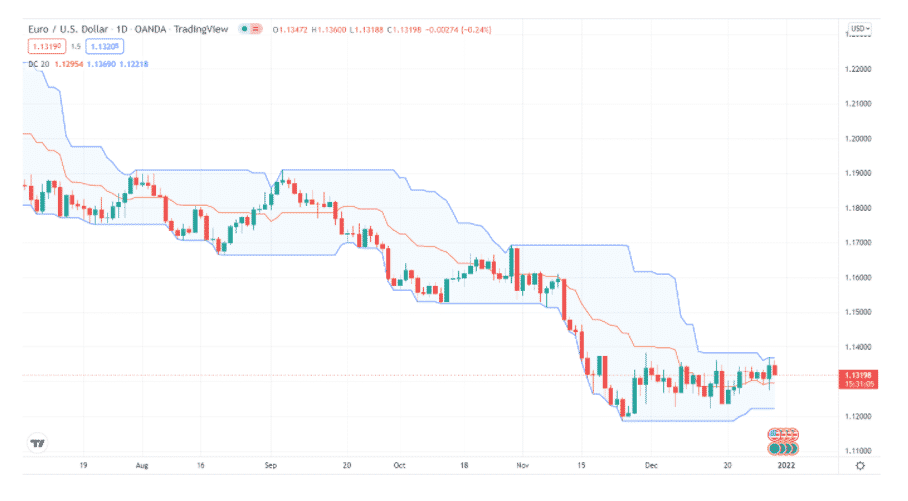
The Donchian channels plot three bands on the chart to give the direction of the trend. The indicator forms three lines, the upper, lower, and middle bands. The upper and lower band indicate price peaks and troughs, while the area between the upper and the lower band is the indicator. This guide will discuss how you can use it for winning strategies.
What is the Donchain channels indicator?
Richard Donchain, the father of the trend-following, developed the indicator in the 1950s. The Donchian channel paints a line between an asset’s peak and low price over a certain time frame.
It is made up of three distinct bands formed by moving average (MA) calculation. The middle band comprises an MA, which we call a channel. You also have the bottom and upper bands.
You compute the value across a set number of periods. The upper one reflects the maximum asset price, while the lower one represents its lowest price. The middle band is simply the sum of the other two.
The indicator looks identical to the Keltner channel and present similar trading opportunities. However, their calculation is different. The indicator also looks identical to the Bollinger Bands. However, the BB is composed of an SMA.

Top five tips for winning with Donchian channels indicator
Let’s consider how you can trade with the indicator for winning strategies.
Here are the top five tips you can apply when trading with the indicator.
Tip 1. For going long
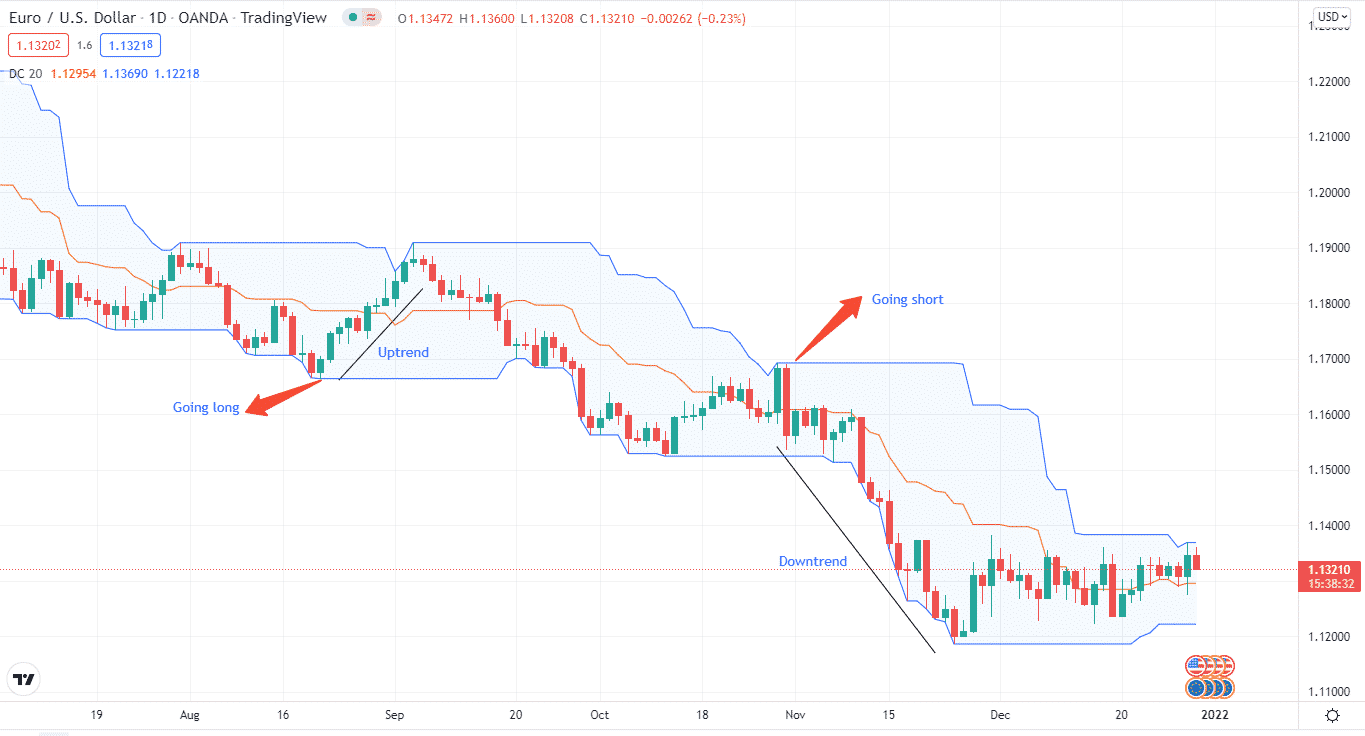
If you want to go long, you must keep a few things in mind. First, when an asset is going higher, its price should routinely hit or come close to the upper band and occasionally move past it. The price should also remain above the bottom band and frequently above the middle or slightly below it.
Overall, this results in the formation of a channel. The rising channel indicates an uptrend, and long trades can be taken.
Why does it happen?
Donchian channels mention price moves as a volatility-based indicator. The movement of the three lines reflects the general trend. As a result, when the lines rise, the trend also rises.
How to avoid the mistake?
At times, markets may get turbulent, so knowing when to go long. However, if the price rises over the middle band or channel on the other side, it represents a good buying opportunity.
Tip 2. For going short
Going short requires the same considerations as buying positions. For example, when a currency pair is heading lower, it should hit or come near the lower band frequently and occasionally move past it.
The price should also remain below the top band and frequently below the middle band or barely push over it.
Why does it happen?
Donchian channels, as previously said, is a volatility-based indicator, and the three lines depict the trend. As a result, when the lines follow a downward path, the trend follows suit.
How to avoid the mistake?
To reduce the possibility of making a mistake, you can enter positions when the price falls below the middle band.

Tip 3. Winning with pullbacks
When the price rises and then falls back to the middle line, it provides an excellent buying opportunity. You can place your stop-loss order between the bottom and middle lines.
In a downturn, however, the price might make a retreat to the middle line, presenting us with a decent entry position.
Why does it happen?
Price does not follow the same trend. Instead, it generates multiple peaks and troughs. Therefore, you must enter the middle line to trade pullbacks with the Donchian channel.
How to avoid the mistake?
Price declines are an unavoidable aspect of the market. To avoid going sideways, you must enter when the price increases or returns to the middle band before entering positions.
Tip 4. Identifying and winning with breakouts
Trading breakouts is another approach you may employ. If the price rises over the upper bank, it represents an excellent time to buy.
On the contrary, selling positions is a wrong entry point if the price falls below the lower band. When the price hits the center band, you exit the trade.
Why does it happen?
The higher band indicates a strong upswing. Similarly, the lower band is a good forecast of an impending decline. As a result, we strongly indicate when the price moves above/below the upper/lower band.
How to avoid the mistake?
The price may make a sharp upward or downward surge before settling sideways. As a result, you must carefully examine the price behavior. Other indications can be used to provide additional validation.
Tip 5. Using the RSI with the Donchian channels
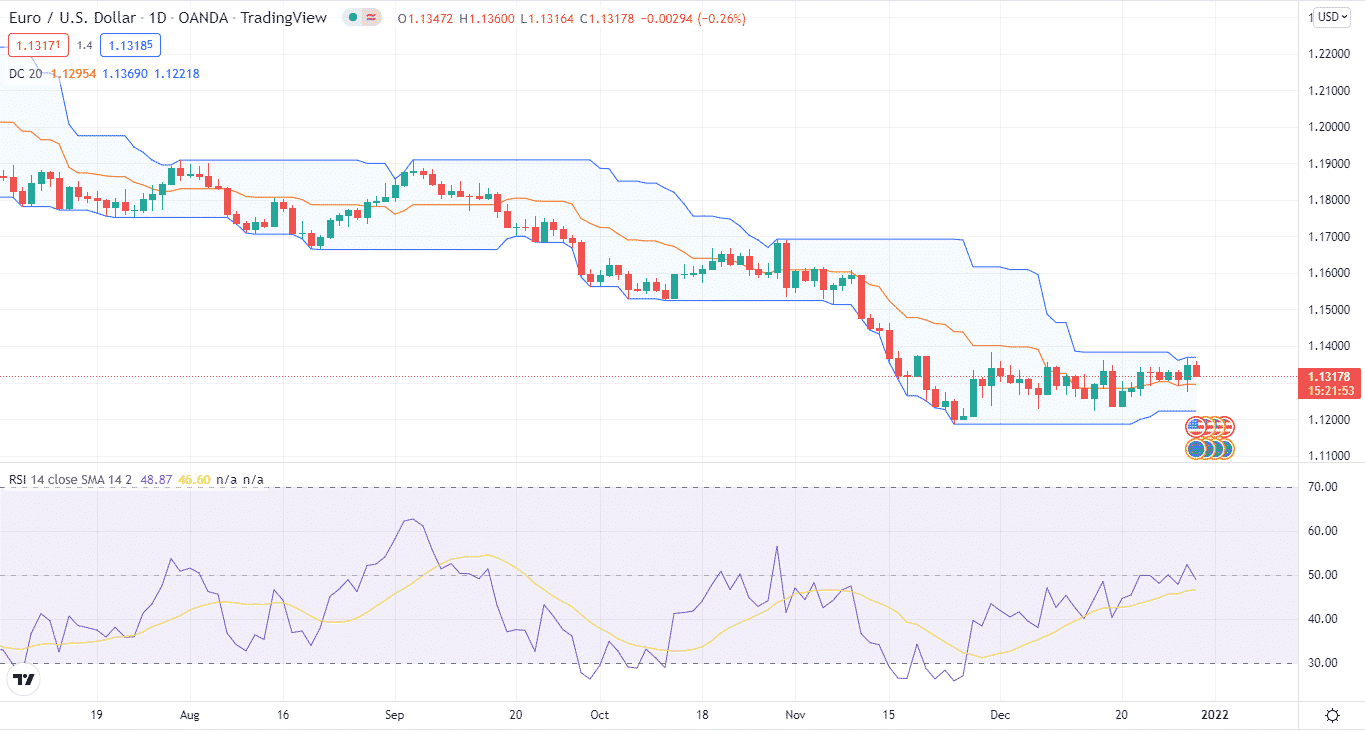
The RSI can also be used in conjunction with the Donchian channel. Combining the RSI and the indicator lowers some of the misleading signals.
For example, we get a good selling signal when the price falls into the lower range, and the RSI rises.
Why does it happen?
One indicator is not superior to the other. As a result, to confirm buy/sell signals, you must combine the Donchian channels with RSI or another oscillator.
How to avoid the mistake?
The Donchian channels can assist in anticipating trend direction, but they can also miss essential trading chances. Therefore, to detect price movements, you must combine additional indicators.

Final thoughts
The Donchian channels are great for finding the current direction of the trend. Like BB, the indicator plots bands for trend direction. The bands provide a clear indicator of price movements. In addition, using the Donchian channels with the RSI or another oscillator further eliminates false signals.


