A trading plan is a crucial element of a trading campaign. It defines your trading process, such as what tools you will use to find trades. Whatever entry tool you use is not the most critical factor. What is more vital is the payoff ratio. Even if your entry strategy has a low win rate, you can still make money as long as you have a high payoff ratio.
A simple tool you can use is a moving average. However, its effectiveness is low. You can add other tools such as price action to improve your win rate. Coupled with a good payoff ratio, you will have a shot at winning in this exciting business.
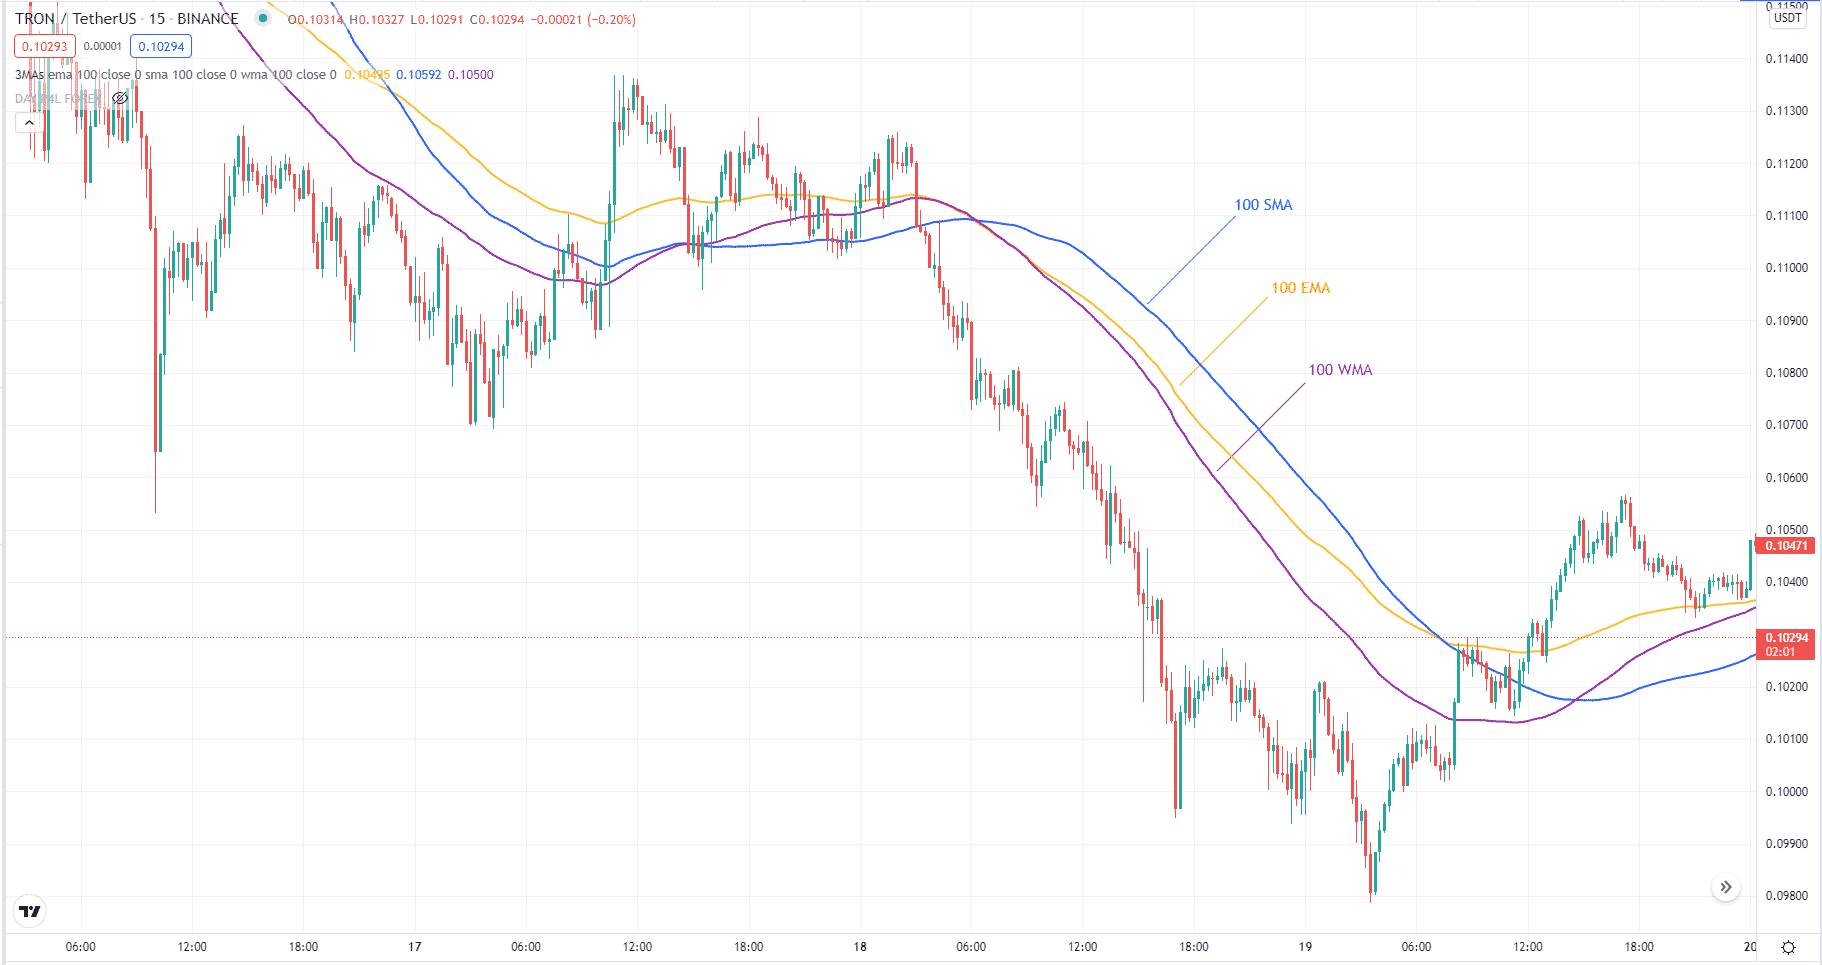
What is the best moving average for 15 minutes? That question has many answers. You cannot find a single answer. The truth is that no single type (e.g., EMA, WMA, or SMA) or period (e.g., 8, 21, or 50) is best on every occasion. Whatever works on your trading is the best. In this article, let us explore the 100 EMA and see if it holds water.
What is the best MA for the 15-minute chart?
When you use lower-period MAs, you will get too many signals but low quality. On the other hand, the 100 EMA allows you to trade with the trend. 100 EMA can quickly tell you the trend on the chart being considered.
As a lagging indicator, 100 EMA is not best used alone. You have to add complementary tools to increase your winning chances. The best tools to pair with 100 EMA are price patterns such as wedges, flags, pennants, and triangles. In the next section, let us learn one trading system that utilizes the 100 EMA and price action.

How to trade with the best moving averages for the 15-minute chart?
The 100 EMA can help you find the trend quickly on the chart you are looking at. Despite being a long-term average, this indicator can still provide plenty of false signals. To avoid this, we will combine this tool with price action.
This trading system may not be so simple, but you can learn it quickly if you give it a serious thought. Think of this system as a reversal or trend-continuing strategy. Therefore, you can find entries at the end of a trend or in the middle of the trend.
Follow the steps below to implement this system.
Entry
Find a scenario where you have a bottom on the first day and a higher low on the second day. This applies to buy setups. For sell setups, find a top on the first day and a lower high on the second day.
Wait for the price to make a new high on the third day. This is for buy setups. For sell setups, wait for the price to make a new low on the third day.
You are ready to enter a trade pending an entry trigger. For a buy setup, the entry trigger is a price break of the 100 EMA to the upside. For a sell setup, the entry trigger is a price break of the 100 EMA to the downside.
Stop-loss
Place your stop loss on the expected day three low for a buy setup and the anticipated day three high for a sell setup.
Take profit
Put your “take profit” either on the next swing point or at a distance two times your risk.
Bullish trade setup

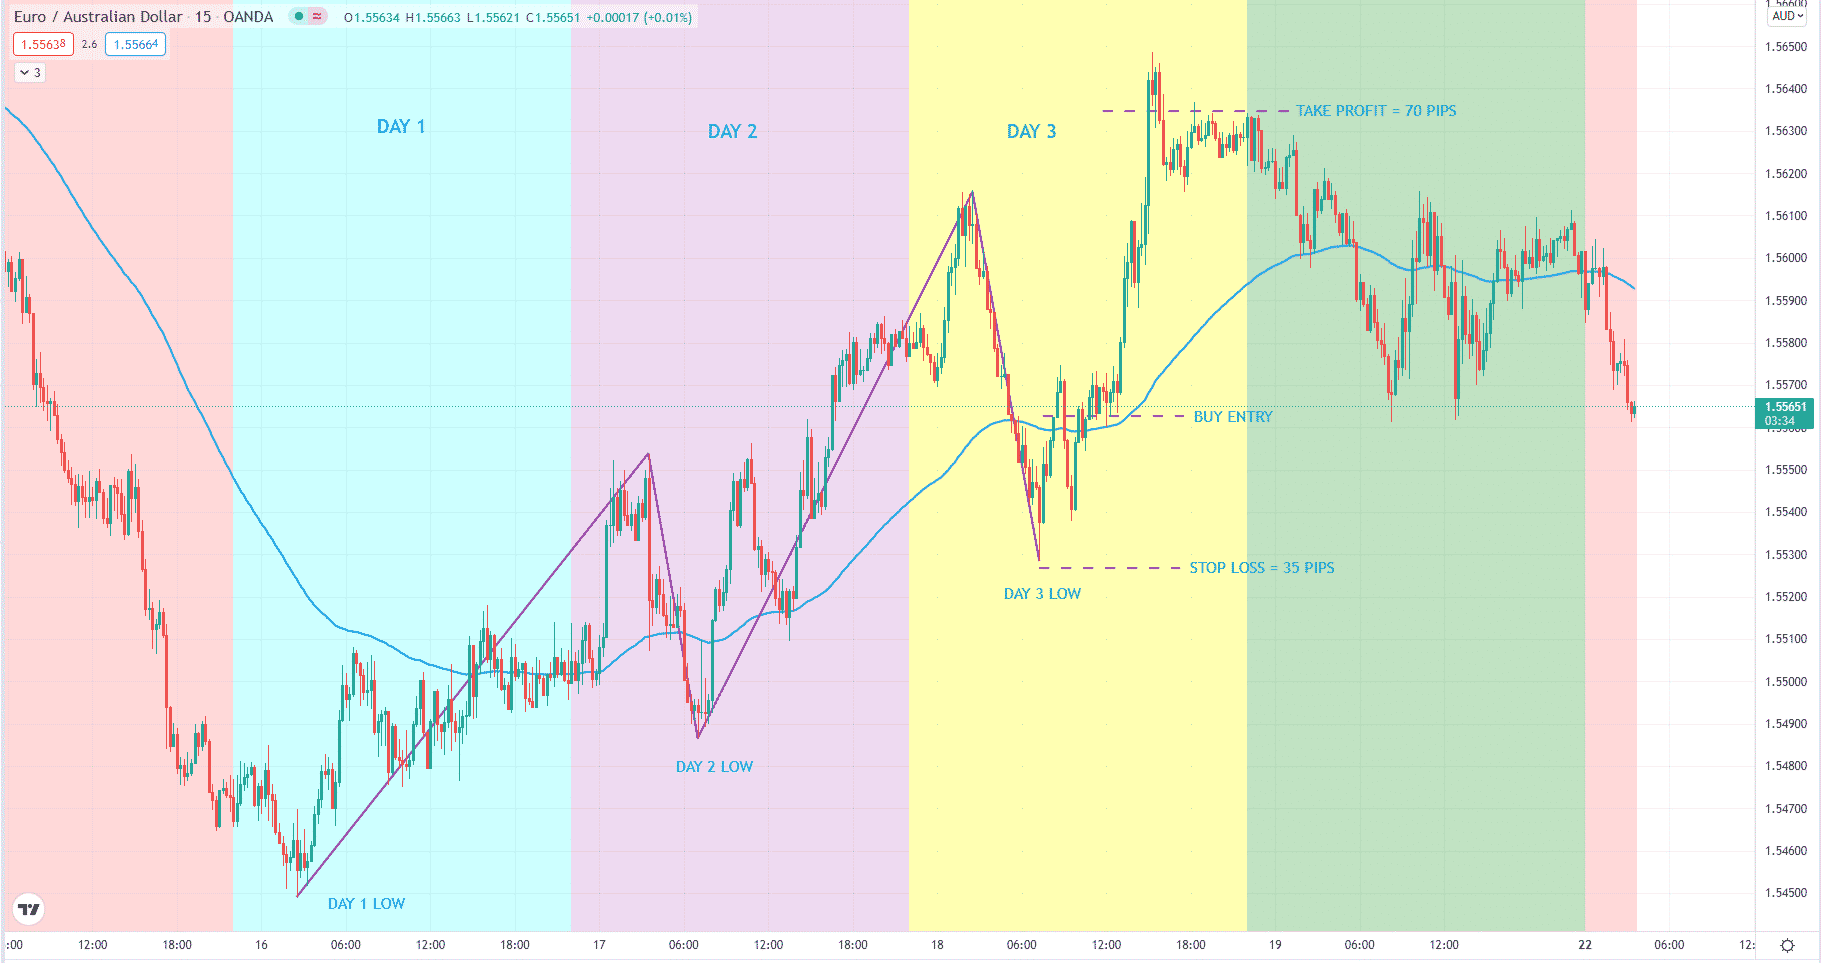
Let us analyze the above 15-minute chart of EUR/AUD. The 100 EMA is plotted as the blue curved line. Here we see that price finds a bottom on day one. Then it registers a higher low on day two and creates a higher high.
Entry
The last price action we await is the formation of a higher low on day three. As you can see above, the price makes a deep retracement. Then it breaks above the 100 EMA. This is our entry. After price breaks and closes above the 100 EMA, you can execute a buy trade.
Stop-loss
Place your stop loss on the low of day three. We expect the price to not break below this point for the trading day.
Take profit
Then we set our target at a point where the expected profit is two times the risk. Price reaches the target within the same trading day.
Bearish trade setup

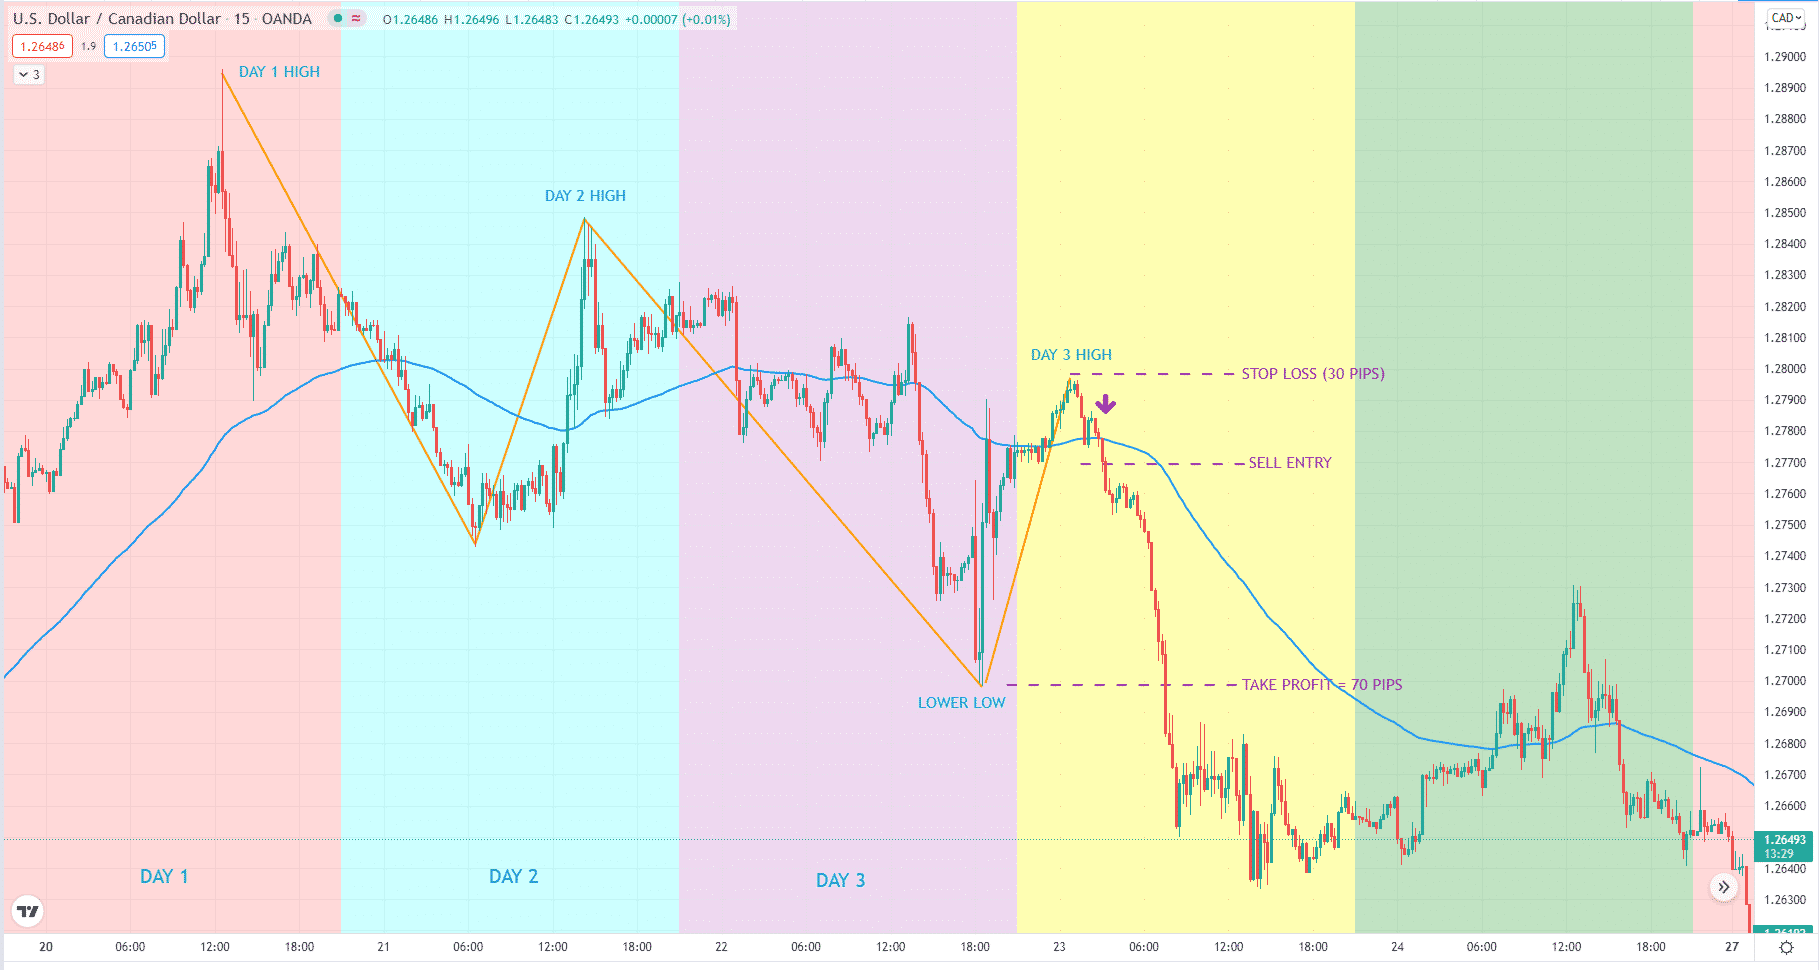
Let us examine the above 15-minute chart of USD/CAD. Here we see that price finds a top on day one. Then it prints a lower high on day two and creates a lower low. The price action we are waiting for is a lower high on day three.
Entry
Although it happened on day three, price action is volatile, so we passed on the trade. On day four, we see price hitting a top and turning around. When it breaks below the 100 EMA, we have our entry. After price breaks and closes below the 100 EMA, you can execute a sell trade.
Stop-loss
Place your stop loss on the high of day four. We expect price not to touch this point on our entry day. Then we set our target at the next swing low. We can get a more excellent payoff ratio than two with this target. After the entry, the price sails smoothly toward our target.
How to manage risks?
For newbie traders, using a stop loss is best for you. It can help protect your account from sudden collapse while you learn the ropes in trading. Sure, you can learn a system on a demo account. You can even double that account quickly. However, trading with real money is an entirely different arena. When emotion is involved because money is on the line, trading takes a different tone. Again, use a stop loss until you learn otherwise.
Final thoughts
Moving averages are helpful tools to include in your trading chest. Every trader has this tool regardless of the market analysis he prefers. The 100 EMA is among the most popular averages. It is a very convenient tool to know the trend at a glance. However, using it as a standalone trading system is not a good idea. Combine it with other tools such as price action, supply and demand, or support and resistance to find trades with greater chances of success.


