Day trading is a process to close all trading activities within a session or day. Therefore, you don’t have to wait for days to get the result. It allows market participants to make frequent trading positions. So traders with daily trading strategies can participate in more profitable trades than traders in higher time frames.
However, there are so many daily trading strategies available to trade in the FX market. Sometimes it is confusing to novice traders to choose the best method.
It is worth checking some factors to determine the best strategy, such as frequent trading opportunities, time duration, profitability, etc. This article includes the very best top three forex daily trading strategies. You can choose any one of them and make constant profitable positions by using it.
Strategy 1. Price action
Price action trading is a very effective way to trade. In the FX market, major players are banks and prominent financial institutes. Price movement occurs by following some patterns as several phases such as accumulation, distribution, markup, and markdown.
Moreover, asset price leaves a footprint behind when price changes occur. History repeats itself in the FX. Price action trading methods work with these patterns, historical data, and technical tools to sort out potentially profitable positions. This method allows traders to do nacked chart trading rather than using complex formulas.
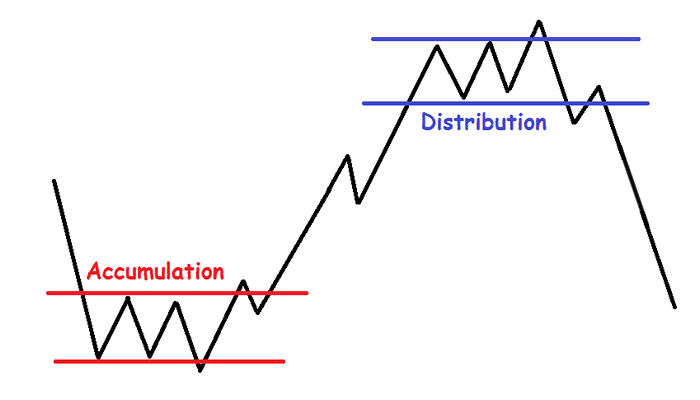
This method can use nacked charts, basic levels, and Fibonacci retracements to sort out trading positions.
Bullish trade setup
Identify a bullish trend in the daily chart of the target currency pair. Then seek buying opportunities at the 1-hour chart. When price creates a recent higher high, place the Fibonacci retracement tool from the recent low to high.
Wait till the price pulls back to 50-61.8% retracement level, and place a buy order. Initial stop loss will be at the 80-100% level with a 10-15 pips buffer below the recent low.
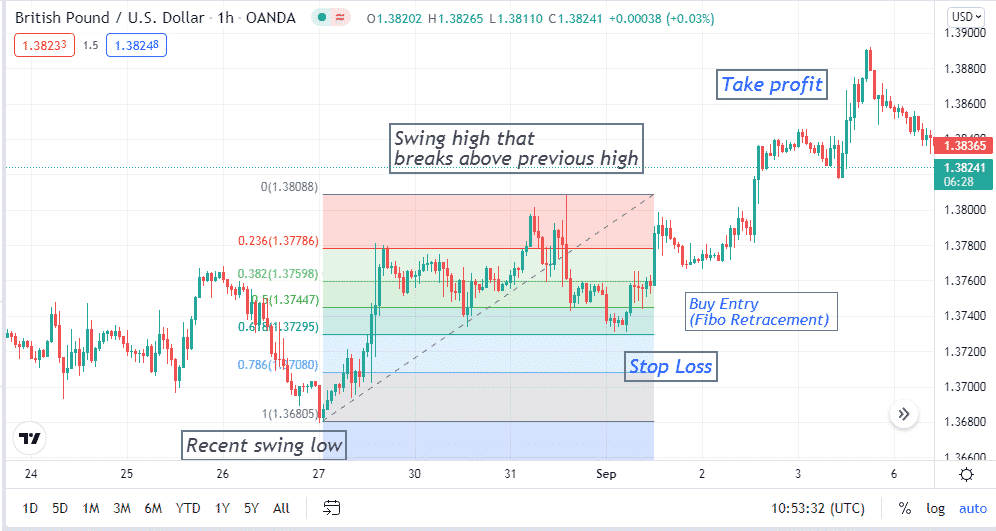
Continue the buy order until the next price pullback comes and close the trade when the price starts to fall back. You can shift your stop loss at or above the breakeven point as a part of trade management.
Bearish trade setup
Identify a bearish trend from the daily chart and seek a selling opportunity at the 1-hour chart. Put the Fibonacci retracement tool from the recent high to the low that breaks the recent low. Wait until the price rises to the 50-61.8% retracement zone, and place a sell order. Initial stop loss will be at the 80-100% zone of the Fibonacci retracement level. Continue the sell order till buyers take control of the asset price.
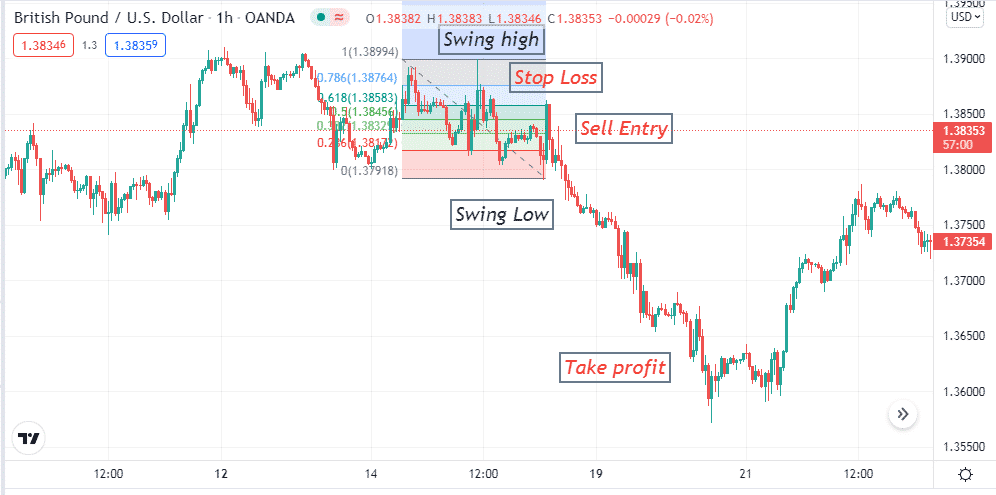
Shift stop loss at or 2-3 pips below the breakeven point when the price creates another lower low.
Strategy 2. Trend trading
Trend trading is another most popular method to trade in the forex market. There is a textbook talk at the FX “trend is always your friend.” It’s true because you can never make consistently profitable trades by going against the trend.
We use a prevalent trend indicator, Relative Trading Strength (RSI), and a technical tool trendline for our trend trading strategy. We will identify trends by drawing trendlines, and confirmation will come from the RSI indicator window before entering the market. This strategy works fine in hourly charts.
Bullish trade setup
Draw a valid trend line by adding three lower lows in the 1-hour chart of the target asset. For more confirmation, check the RSI indicator window. The signal line of the RSI indicator window remains above the middle line; then, it is a bullish scenario. Place buy order. Initial stop loss will be below the recent low and definitely below the trendline with a buffer of 10-15 pips. Continue the buy order till the price remains at an uptrend.
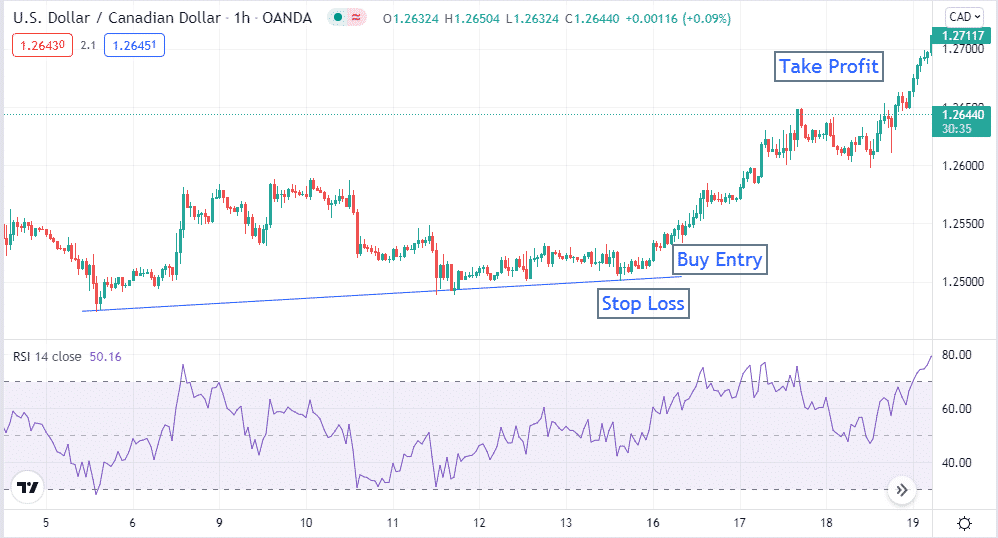
Close buy order when the RSI signal line falls back from the upper line toward the middle line.
Bearish trade setup
Draw a valid trendline by adding three higher highs in the 1-hour chart. For more confirmation, check the RSI indicator window. It confirms a bearish trend if the signal line remains below the middle line and heading toward the lower line. Place a sell order here. Put an initial stop loss above the trendline with a buffer of 10-15 pips.
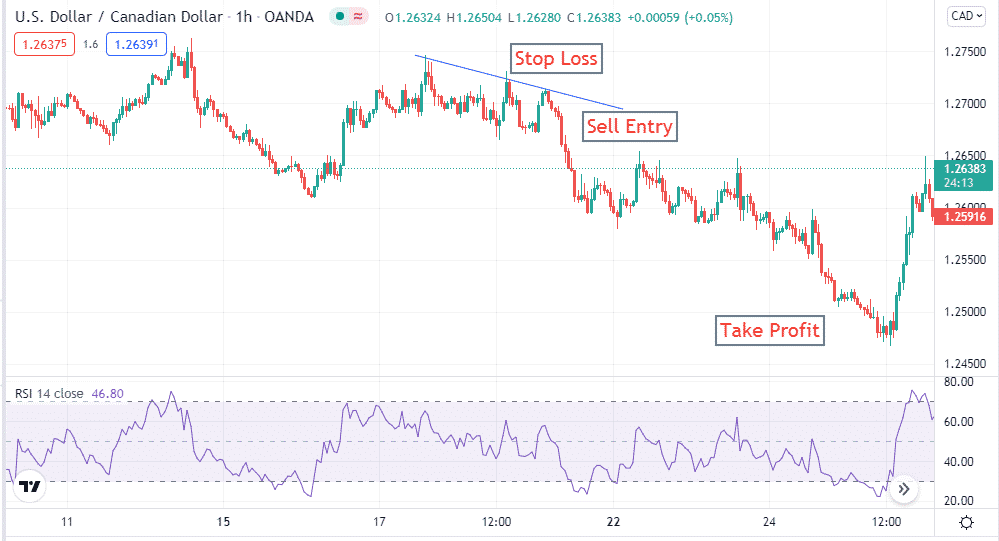
Continue the close order till the trend remains intact. Close the sell position when the signal line starts to come back toward the middle line by reaching the lower line of the RSI window.
Strategy 3. Swing trading
Swing trading is famous for all financial traders such as FX, commodity, stock traders, etc. We use support resistance (S&R) and a popular technical indicator Moving average convergence/divergence (MACD) for catching swing trading positions.
This strategy works fine for short-term traders, and a 1-hour chart is ideal for this strategy. First, identify the S&R levels, then make an entry by confirmation from the MACD window.
Bullish trade setup
Check the price reaction at the S&R level. When the price rejects going further down by creating a lower low at any support level, check the MACD window for more confirmation. Check if the MACD blue signal line crosses above the red signal line and the histogram bar appears above the middle line. If all these conditions are true, it is a bullish situation and ideal to put buy order. Set a stop loss below the support level with a buffer of 10-15 pips.
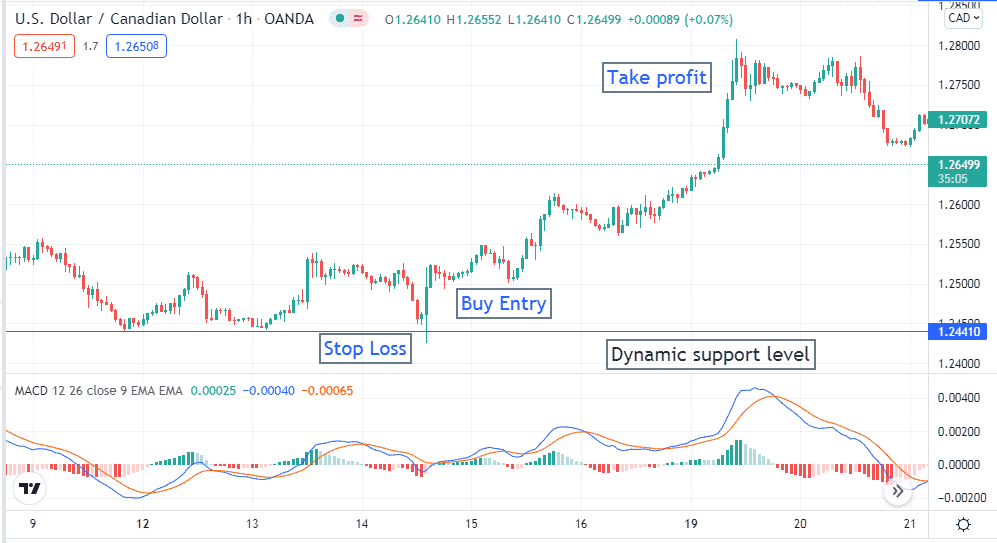
Close the buy position when the opposite crossover happens between the signal lines of the MACD window.
Bearish trade setup
Check the price reaction at the resistance levels. When the price makes a swing high and rejects to go further upward at any resistance level, check the MACD window for more confirmation. If the blue signal line crosses below the red signal line and histogram bars appear below the MACD window’s middle line, it indicates a bearish scenario. It is an ideal place to put a sell order.
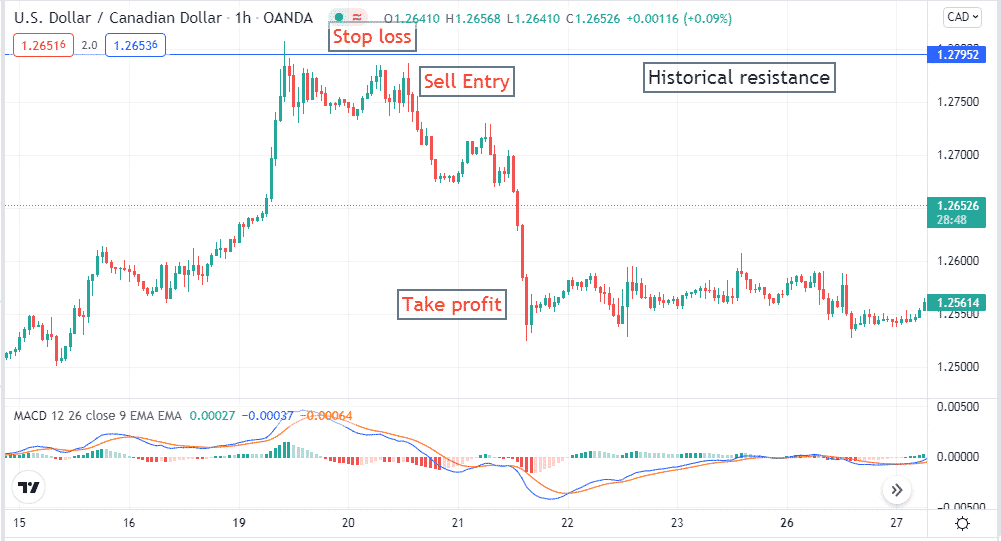
Place stop loss above the resistance line with a buffer of 10-15 pips. Close the sell position when the opposite crossover happens between signal lines of the MACD window.
Final thought
Finally, you already know the best three FX day trading strategies. These are the best as you will get frequent trading positions by using any one of them. The risk ratio is also low for these trading methods. We suggest practicing these methods at the demo trading chart before using them for actual trading. When you implement any one of these on your chart, you will know the accuracy of these methods.


